Comparative transcriptome profiling analyses during the lag phase uncover YAP1, PDR1, PDR3, RPN4, and HSF1 as key regulatory genes in genomic adaptation to the lignocellulose derived inhibitor HMF for Saccharomyces cerevisiae
- PMID: 21106074
- PMCID: PMC3091778
- DOI: 10.1186/1471-2164-11-660
Comparative transcriptome profiling analyses during the lag phase uncover YAP1, PDR1, PDR3, RPN4, and HSF1 as key regulatory genes in genomic adaptation to the lignocellulose derived inhibitor HMF for Saccharomyces cerevisiae
Abstract
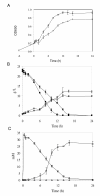
Background: The yeast Saccharomyces cerevisiae is able to adapt and in situ detoxify lignocellulose derived inhibitors such as furfural and HMF. The length of lag phase for cell growth in response to the inhibitor challenge has been used to measure tolerance of strain performance. Mechanisms of yeast tolerance at the genome level remain unknown. Using systems biology approach, this study investigated comparative transcriptome profiling, metabolic profiling, cell growth response, and gene regulatory interactions of yeast strains and selective gene deletion mutations in response to HMF challenges during the lag phase of growth.
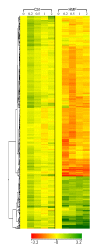
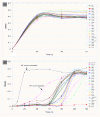
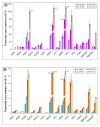
Results: We identified 365 candidate genes and found at least 3 significant components involving some of these genes that enable yeast adaptation and tolerance to HMF in yeast. First, functional enzyme coding genes such as ARI1, ADH6, ADH7, and OYE3, as well as gene interactions involved in the biotransformation and inhibitor detoxification were the direct driving force to reduce HMF damages in cells. Expressions of these genes were regulated by YAP1 and its closely related regulons. Second, a large number of PDR genes, mainly regulated by PDR1 and PDR3, were induced during the lag phase and the PDR gene family-centered functions, including specific and multiple functions involving cellular transport such as TPO1, TPO4, RSB1, PDR5, PDR15, YOR1, and SNQ2, promoted cellular adaptation and survival in order to cope with the inhibitor stress. Third, expressed genes involving degradation of damaged proteins and protein modifications such as SHP1 and SSA4, regulated by RPN4, HSF1, and other co-regulators, were necessary for yeast cells to survive and adapt the HMF stress. A deletion mutation strain Δrpn4 was unable to recover the growth in the presence of HMF.
Conclusions: Complex gene interactions and regulatory networks as well as co-regulations exist in yeast adaptation and tolerance to the lignocellulose derived inhibitor HMF. Both induced and repressed genes involving diversified functional categories are accountable for adaptation and energy rebalancing in yeast to survive and adapt the HMF stress during the lag phase of growth. Transcription factor genes YAP1, PDR1, PDR3, RPN4, and HSF1 appeared to play key regulatory rules for global adaptation in the yeast S. cerevisiae.
Figures


Similar articles
-
Pathway-based signature transcriptional profiles as tolerance phenotypes for the adapted industrial yeast Saccharomyces cerevisiae resistant to furfural and HMF.Appl Microbiol Biotechnol. 2020 Apr;104(8):3473-3492. doi: 10.1007/s00253-020-10434-0. Epub 2020 Feb 26. Appl Microbiol Biotechnol. 2020. PMID: 32103314
-
Membrane-active compounds activate the transcription factors Pdr1 and Pdr3 connecting pleiotropic drug resistance and membrane lipid homeostasis in saccharomyces cerevisiae.Mol Biol Cell. 2007 Dec;18(12):4932-44. doi: 10.1091/mbc.e07-06-0610. Epub 2007 Sep 19. Mol Biol Cell. 2007. PMID: 17881724 Free PMC article.
-
Refining current knowledge on the yeast FLR1 regulatory network by combined experimental and computational approaches.Mol Biosyst. 2010 Dec;6(12):2471-81. doi: 10.1039/c004881j. Epub 2010 Oct 11. Mol Biosyst. 2010. PMID: 20938527
-
Genomic adaptation of ethanologenic yeast to biomass conversion inhibitors.Appl Microbiol Biotechnol. 2006 Nov;73(1):27-36. doi: 10.1007/s00253-006-0567-3. Epub 2006 Oct 7. Appl Microbiol Biotechnol. 2006. PMID: 17028874 Review.
-
Yeast multidrug resistance: the PDR network.J Bioenerg Biomembr. 1995 Feb;27(1):71-6. doi: 10.1007/BF02110333. J Bioenerg Biomembr. 1995. PMID: 7629054 Review.
Cited by
-
Regulation of proteasome activity in health and disease.Biochim Biophys Acta. 2014 Jan;1843(1):13-25. doi: 10.1016/j.bbamcr.2013.08.012. Epub 2013 Aug 27. Biochim Biophys Acta. 2014. PMID: 23994620 Free PMC article. Review.
-
The Identification of Genetic Determinants of Methanol Tolerance in Yeast Suggests Differences in Methanol and Ethanol Toxicity Mechanisms and Candidates for Improved Methanol Tolerance Engineering.J Fungi (Basel). 2021 Jan 27;7(2):90. doi: 10.3390/jof7020090. J Fungi (Basel). 2021. PMID: 33513997 Free PMC article.
-
Transcriptomic analysis of formic acid stress response in Saccharomyces cerevisiae.World J Microbiol Biotechnol. 2022 Jan 6;38(2):34. doi: 10.1007/s11274-021-03222-z. World J Microbiol Biotechnol. 2022. PMID: 34989900
-
RNA sequencing reveals metabolic and regulatory changes leading to more robust fermentation performance during short-term adaptation of Saccharomyces cerevisiae to lignocellulosic inhibitors.Biotechnol Biofuels. 2021 Oct 15;14(1):201. doi: 10.1186/s13068-021-02049-y. Biotechnol Biofuels. 2021. PMID: 34654441 Free PMC article.
-
A role for FACT in repopulation of nucleosomes at inducible genes.PLoS One. 2014 Jan 2;9(1):e84092. doi: 10.1371/journal.pone.0084092. eCollection 2014. PLoS One. 2014. PMID: 24392107 Free PMC article.
References
-
- Bothast RJ, Saha BC. Ethanol production from agricultural biomass substrate. Adv Appl Microbiol. 1997;44:261–286. full_text.
-
- Outlaw J, Collins K, Duffield J. Agriculture as a producer and consumer of energy. CAB International, Wallingford, UK; 2005.
-
- Liu ZL, Saha BC, Slininger PJ. In: Bioenergy. 1. Wall J, Harwood C, Demain A, editor. Washington, DC: ASM Press; 2008. Lignocellulose biomass conversion to ethanol by Saccharomyces; pp. 17–36.
Publication types
MeSH terms
Substances
LinkOut - more resources
Full Text Sources
Other Literature Sources
Molecular Biology Databases

