

Eco-evolutionary dynamics, coding structure and the information threshold
- PMID: 21106077
- PMCID: PMC3001725
- DOI: 10.1186/1471-2148-10-361
Eco-evolutionary dynamics, coding structure and the information threshold
Abstract
Background: The amount of information that can be maintained in an evolutionary system of replicators is limited by genome length, the number of errors during replication (mutation rate) and various external factors that influence the selection pressure. To date, this phenomenon, known as the information threshold, has been studied (both genotypically and phenotypically) in a constant environment and with respect to maintenance (as opposed to accumulation) of information. Here we take a broader perspective on this problem by studying the accumulation of information in an ecosystem, given an evolvable coding structure. Moreover, our setup allows for individual based as well as ecosystem based solutions. That is, all functions can be performed by individual replicators, or complementing functions can be performed by different replicators. In this setup, where both the ecosystem and the individual genomes can evolve their structure, we study how populations cope with high mutation rates and accordingly how the information threshold might be alleviated.
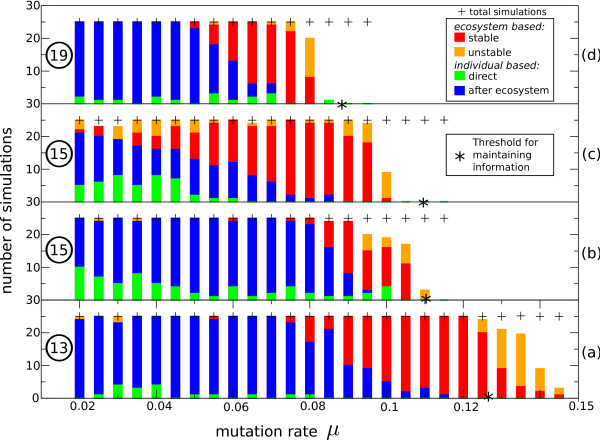
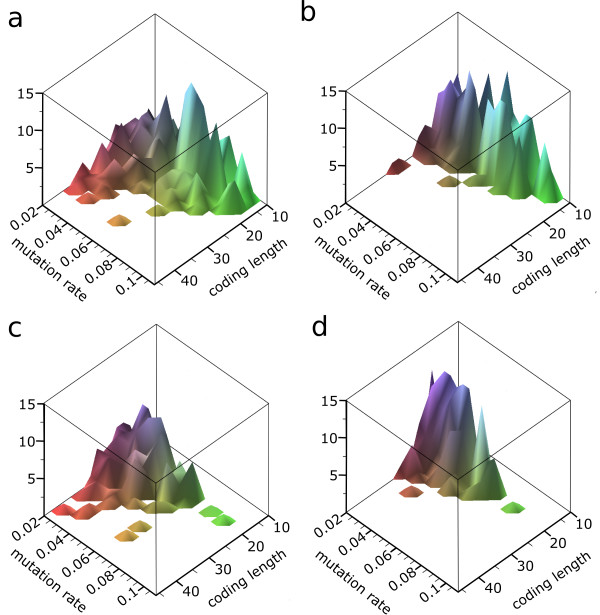
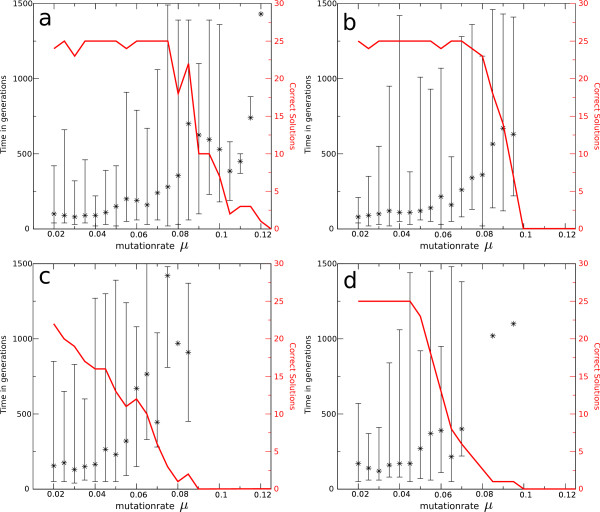
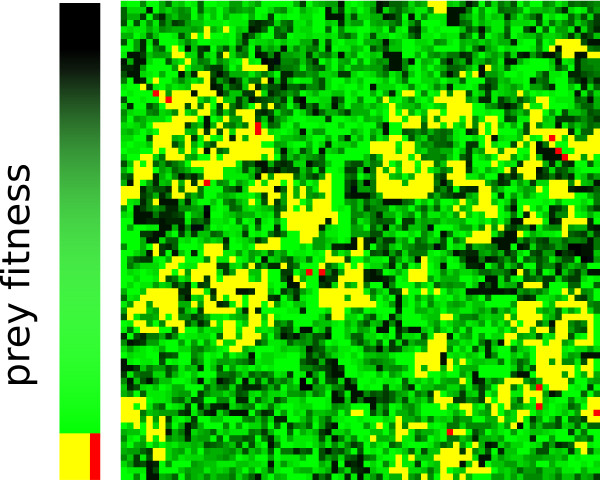
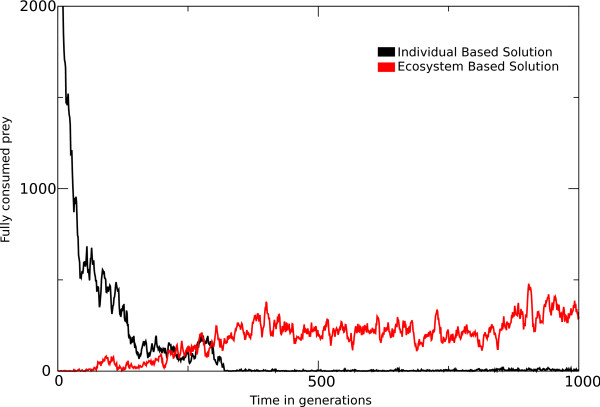
Results: We observe that the first response to increased mutation rates is a change in coding structure. At moderate mutation rates evolution leads to longer genomes with a higher diversity than at high mutation rates. Thus, counter-intuitively, at higher mutation rates diversity is reduced and the efficacy of the evolutionary process is decreased. Therefore, moderate mutation rates allow for more degrees of freedom in exploring genotype space during the evolutionary trajectory, facilitating the emergence of solutions. When an individual based solution cannot be attained due to high mutation rates, spatial structuring of the ecosystem can accommodate the evolution of ecosystem based solutions.
Conclusions: We conclude that the evolutionary freedom (eg. the number of genotypes that can be reached by evolution) is increasingly restricted by higher mutation rates. In the case of such severe mutation rates that an individual based solution cannot be evolved, the ecosystem can take over and still process the required information forming ecosystem based solutions. We provide a proof of principle for species fulfilling the different roles in an ecosystem when single replicators can no longer cope with all functions simultaneously. This could be a first step in crossing the information threshold.
Figures
Similar articles
-
Less can be more: RNA-adapters may enhance coding capacity of replicators.PLoS One. 2012;7(1):e29952. doi: 10.1371/journal.pone.0029952. Epub 2012 Jan 23. PLoS One. 2012. PMID: 22291898 Free PMC article.
-
Evolution of functional diversification within quasispecies.Genome Biol Evol. 2014 Jul 22;6(8):1990-2007. doi: 10.1093/gbe/evu150. Genome Biol Evol. 2014. PMID: 25056399 Free PMC article.
-
Evolution of complexity in RNA-like replicator systems.Biol Direct. 2008 Mar 27;3:11. doi: 10.1186/1745-6150-3-11. Biol Direct. 2008. PMID: 18371199 Free PMC article.
-
Toward a theory of multilevel evolution: long-term information integration shapes the mutational landscape and enhances evolvability.Adv Exp Med Biol. 2012;751:195-224. doi: 10.1007/978-1-4614-3567-9_10. Adv Exp Med Biol. 2012. PMID: 22821460 Review.
-
Population and evolutionary dynamics in spatially structured seasonally varying environments.Biol Rev Camb Philos Soc. 2018 Aug;93(3):1578-1603. doi: 10.1111/brv.12409. Epub 2018 Mar 25. Biol Rev Camb Philos Soc. 2018. PMID: 29575449 Free PMC article. Review.
Cited by
-
Less can be more: RNA-adapters may enhance coding capacity of replicators.PLoS One. 2012;7(1):e29952. doi: 10.1371/journal.pone.0029952. Epub 2012 Jan 23. PLoS One. 2012. PMID: 22291898 Free PMC article.
-
Reductive genome evolution at both ends of the bacterial population size spectrum.Nat Rev Microbiol. 2014 Dec;12(12):841-50. doi: 10.1038/nrmicro3331. Epub 2014 Sep 15. Nat Rev Microbiol. 2014. PMID: 25220308
-
The roots of bioinformatics in theoretical biology.PLoS Comput Biol. 2011 Mar;7(3):e1002021. doi: 10.1371/journal.pcbi.1002021. Epub 2011 Mar 31. PLoS Comput Biol. 2011. PMID: 21483479 Free PMC article.
-
Evolution of functional diversification within quasispecies.Genome Biol Evol. 2014 Jul 22;6(8):1990-2007. doi: 10.1093/gbe/evu150. Genome Biol Evol. 2014. PMID: 25056399 Free PMC article.
-
Evolution of evolvability and phenotypic plasticity in virtual cells.BMC Evol Biol. 2017 Feb 28;17(1):60. doi: 10.1186/s12862-017-0918-y. BMC Evol Biol. 2017. PMID: 28241744 Free PMC article.
References
-
- Maynard Smith J, Brook field JFY. Models of Evolution. Proceedings of the Royal Society of London. Series B, Biological Sciences. 1983;219:315–325. doi: 10.1098/rspb.1983.0076. - DOI
-
- Szathmáry E. The integration of the earliest genetic information. Trends in Ecology & Evolution. 1989;4(7):200–204. - PubMed
Publication types
MeSH terms
LinkOut - more resources
Full Text Sources
