. 2010 Nov 24:11:662.
doi: 10.1186/1471-2164-11-662.

Evaluation of external RNA controls for the standardisation of gene expression biomarker measurements

Affiliations

Evaluation of external RNA controls for the standardisation of gene expression biomarker measurements

Alison S Devonshire et al. BMC Genomics. .

Abstract

Background: Gene expression profiling is an important approach for detecting diagnostic and prognostic biomarkers, and predicting drug safety. The development of a wide range of technologies and platforms for measuring mRNA expression makes the evaluation and standardization of transcriptomic data problematic due to differences in protocols, data processing and analysis methods. Thus, universal RNA standards, such as those developed by the External RNA Controls Consortium (ERCC), are proposed to aid validation of research findings from diverse platforms such as microarrays and RT-qPCR, and play a role in quality control (QC) processes as transcriptomic profiling becomes more commonplace in the clinical setting.

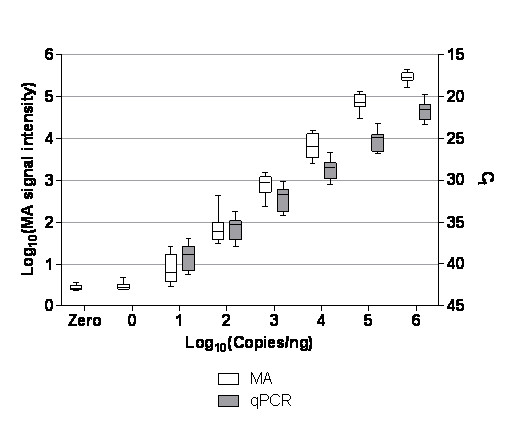
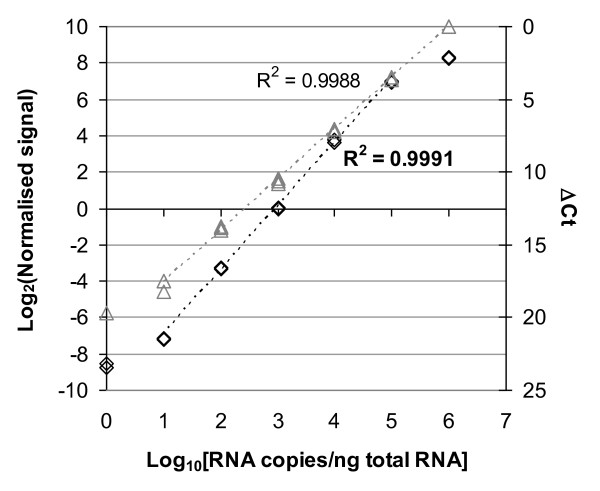
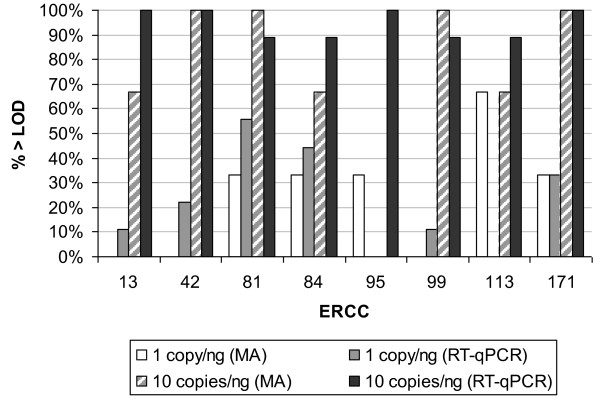
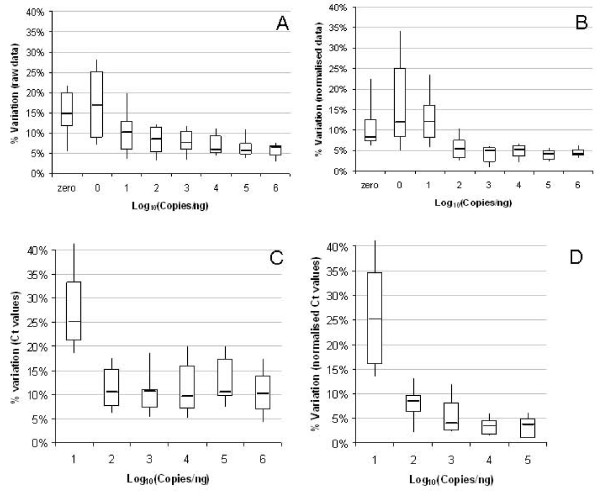
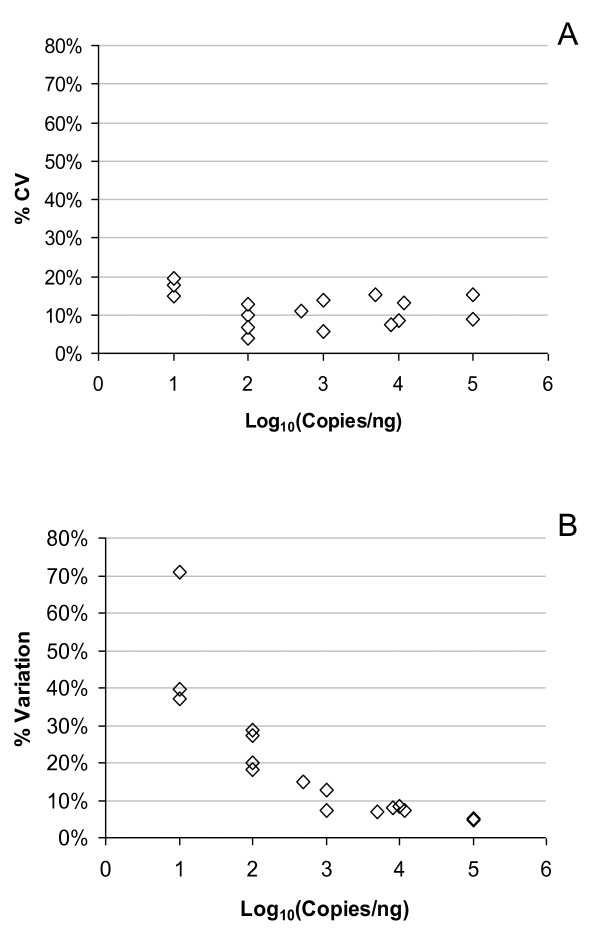
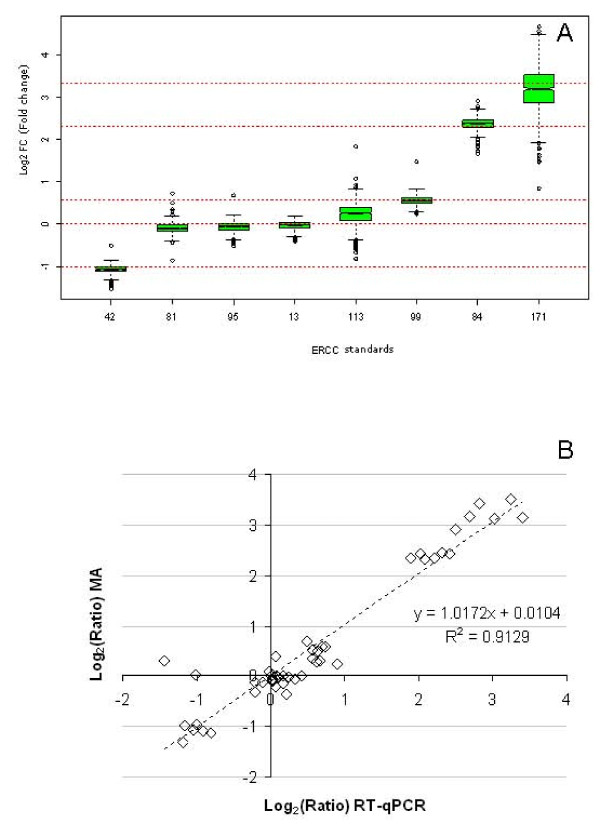
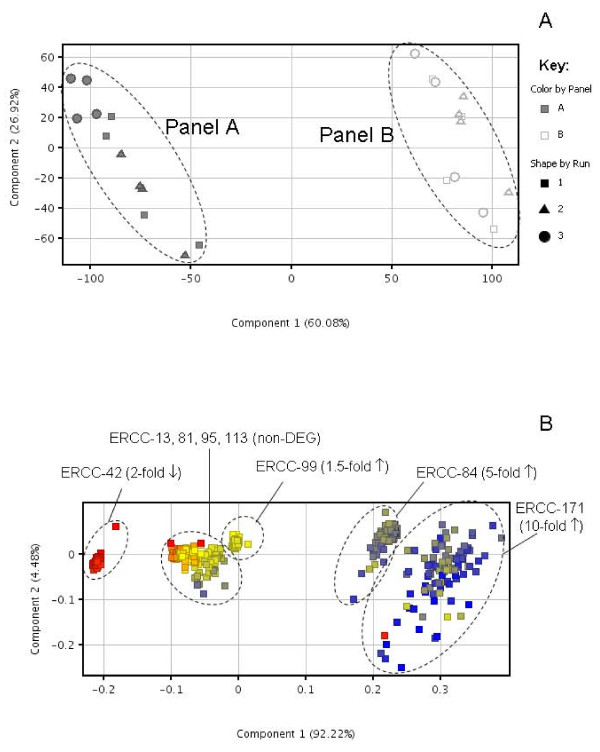
Results: Panels of ERCC RNA standards were constructed in order to test the utility of these reference materials (RMs) for performance characterization of two selected gene expression platforms, and for discrimination of biomarker profiles between groups. The linear range, limits of detection and reproducibility of microarray and RT-qPCR measurements were evaluated using panels of RNA standards. Transcripts of low abundance (≤ 10 copies/ng total RNA) showed more than double the technical variability compared to higher copy number transcripts on both platforms. Microarray profiling of two simulated 'normal' and 'disease' panels, each consisting of eight different RNA standards, yielded robust discrimination between the panels and between standards with varying fold change ratios, showing no systematic effects due to different labelling and hybridization runs. Also, comparison of microarray and RT-qPCR data for fold changes showed agreement for the two platforms.

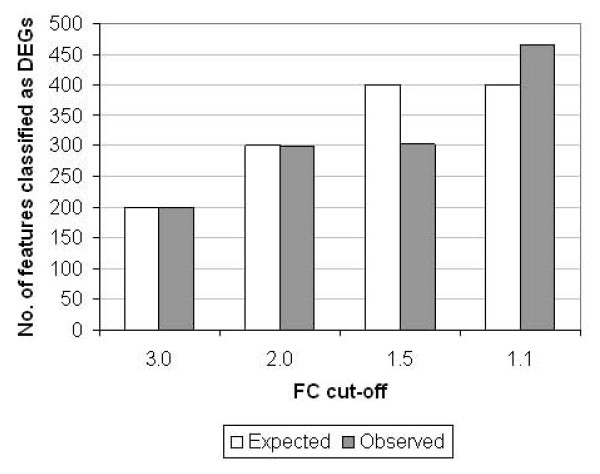
Conclusions: ERCC RNA standards provide a generic means of evaluating different aspects of platform performance, and can provide information on the technical variation associated with quantification of biomarkers expressed at different levels of physiological abundance. Distinct panels of standards serve as an ideal quality control tool kit for determining the accuracy of fold change cut-off threshold and the impact of experimentally-derived noise on the discrimination of normal and disease profiles.


Figures

Figure 1
Figure 1
Characterisation of platform signal output using RNA standards. Signal output data for all eight standards across a tested range between 0 and 106 copies/ng total RNA are shown as box-whisker diagrams for microarray (white bars) and RT-qPCR (grey bars) applications. Median signal output (central line), interquartile range and minimum and maximum values are shown for each level of transcript abundance.
Figure 2
Figure 2
Linear range of detection on microarray and RT-qPCR platforms. Example plots of modelling the linear range of each gene expression platform are displayed. Normalised signal intensities (microarrays) (symbol: black diamond) or ΔCt values (RT-qPCR) (symbol: grey triangle) are plotted against the standard (copy number/ng). Individual data points for ERCC-13 from three independent experiments are plotted. Correlation analysis was performed over the linear portion of the detection range (Microarrays: 10-105 copies/ng; RT-qPCR 10 - 106 copies/ng) and Pearson correlation coefficient (R2) values are displayed (microarray value in bold).
Figure 3
Figure 3
LOD of ERCC standards on microarray and RT-qPCR platforms. Percentage of assays exceeding the LOD for microarray (MA) and RT-qPCR platforms are displayed for each RNA standard for 1 copy/ng and 10 copies/ng total RNA abundance levels (Table 1), based on three replicate assays (microarrays) or nine replicate PCR assays (RT-qPCR). LOD is defined as the upper limit of the 95% confidence interval of 0 copies (microarrays) or positive Ct values (RT-qPCR).
Figure 4
Figure 4
Technical reproducibility of microarray and RT-qPCR platforms. Technical reproducibility of microarray and RT-qPCR data was calculated based on the technical variation of each standard across three independent experiments using the same labelled sample (microarrays) or cDNA sample (RT-qPCR). Box-whisker plots show the median signal output (central line), interquartile range and 10th and 90th percentile values for each level of transcript abundance. Distribution of technical variation across all tested standards are displayed as percentage CV of microarray raw signal (SD/mean)(A), percentage variation associated with normalized signal intensity (log2) based on SD of normalized values (B), percentage variation in expression quantities (based on SD of Ct values, corrected for PCR efficiency of each assay)(C) and percentage variation in expression quantities, expressed relative to the mean Ct value for 106 copies/ng within each run (D).
Figure 5
Figure 5
Technical precision of replicate assays. Precision of replicate measurements made within the same experimental run are plotted against copy number of the standards. Mean variation in raw signal intensities or Ct values across three independent runs are shown for microarray (A) and RT-qPCR (B), based on duplicate arrays or triplicate qPCR reactions within each run.
Figure 6
Figure 6
Accuracy of fold change estimation. The fold change in expression levels between panels A and B was calculated based on six pair-wise comparisons across three experimental runs. (A) The distribution of fold change measurements are displayed for each ERCC standard based on 100 individual microarray features for each standard. Box-whisker plots reflect median, interquartile range, 10th and 90th percentile fold change values with dots indicating individual outliers. Expected values for fold changes are indicated by gridlines. (B) Microarray observed fold change values averaged across all 100 probe replicates are plotted against fold change measurements from RT-qPCR data as individual data points (n = 6 for each ERCC standard). Trendline indicates correlation analysis with calculated slope and Pearson's correlation coefficient (R).
Figure 7
Figure 7
Classification of DEGs. The expected and observed number of ERCC microarray features classified as DEGs are compared using fold change cut-offs of 3.0, 2.0, 1.5 and 1.1. A statistical cut-off of p < 0.05 was applied. Analysis was based on averaged data for 'normal' and 'disease' panels A and B (n = 6) with 100 microarray features present for each ERCC standard.
Figure 8
Figure 8
Discrimination between expression profiles of ERCC microarray data. The discrimination between ERCC 'normal' and 'disease' panels A and B across three independent microarray experiments (Runs 1, 2, 3) was assessed in the following ways: (A) PCA was performed using expression data for all eight ERCC standards containing 100 replicates of each probe based on conditions (panel and experimental run). (B) Discrimination of microarray measurements between DEGs and non-DEGs was assessed by PCA based on entities. Dots represent individual microarray features (100 per standard).

Similar articles

Cited by

References

    1. Waring JF, Halbert DN. The promise of toxicogenomics. Curr Opin Mol Ther. 2002;4:229–235. - PubMed
    1. Bhattacharya S, Mariani TJ. Array of hope: expression profiling identifies disease biomarkers and mechanism. Biochem Soc Trans. 2009;37:855–862. doi: 10.1042/BST0370855. - DOI - PubMed
    1. Bustin SA, Dorudi S. Gene expression profiling for molecular staging and prognosis prediction in colorectal cancer. Expert Rev Mol Diagn. 2004;4:599–607. doi: 10.1586/14737159.4.5.599. - DOI - PubMed
    1. Ross JS, Hatzis C, Symmans WF, Pusztai L, Hortobagyi GN. Commercialized multigene predictors of clinical outcome for breast cancer. Oncologist. 2008;13:477–493. doi: 10.1634/theoncologist.2007-0248. - DOI - PubMed
    1. Buyse M, Loi S, van't Veer L, Viale G, Delorenzi M, Glas AM, Saghatchian d'Assignies M, Bergh J, Lidereau R, Ellis P. et al.Validation and Clinical Utility of a 70-Gene Prognostic Signature for Women With Node-Negative Breast Cancer. J Natl Cancer Inst. 2006;98:1183–1192. doi: 10.1093/jnci/djj329. - DOI - PubMed

LinkOut - more resources