Confidence from uncertainty--a multi-target drug screening method from robust control theory
- PMID: 21106087
- PMCID: PMC3277951
- DOI: 10.1186/1752-0509-4-161
Confidence from uncertainty--a multi-target drug screening method from robust control theory
Abstract
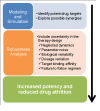
Background: Robustness is a recognized feature of biological systems that evolved as a defence to environmental variability. Complex diseases such as diabetes, cancer, bacterial and viral infections, exploit the same mechanisms that allow for robust behaviour in healthy conditions to ensure their own continuance. Single drug therapies, while generally potent regulators of their specific protein/gene targets, often fail to counter the robustness of the disease in question. Multi-drug therapies offer a powerful means to restore disrupted biological networks, by targeting the subsystem of interest while preventing the diseased network from reconciling through available, redundant mechanisms. Modelling techniques are needed to manage the high number of combinatorial possibilities arising in multi-drug therapeutic design, and identify synergistic targets that are robust to system uncertainty.
Results: We present the application of a method from robust control theory, Structured Singular Value or μ- analysis, to identify highly effective multi-drug therapies by using robustness in the face of uncertainty as a new means of target discrimination. We illustrate the method by means of a case study of a negative feedback network motif subject to parametric uncertainty.
Conclusions: The paper contributes to the development of effective methods for drug screening in the context of network modelling affected by parametric uncertainty. The results have wide applicability for the analysis of different sources of uncertainty like noise experienced in the data, neglected dynamics, or intrinsic biological variability.
Figures


Similar articles
-
Screening drug target combinations in disease-related molecular networks.BMC Bioinformatics. 2019 May 1;20(Suppl 7):198. doi: 10.1186/s12859-019-2730-8. BMC Bioinformatics. 2019. PMID: 31074386 Free PMC article.
-
The theory of biological robustness and its implication in cancer.Ernst Schering Res Found Workshop. 2007;(61):69-88. doi: 10.1007/978-3-540-31339-7_4. Ernst Schering Res Found Workshop. 2007. PMID: 17249497 Review.
-
Conditional robustness analysis for fragility discovery and target identification in biochemical networks and in cancer systems biology.BMC Syst Biol. 2015 Oct 19;9:70. doi: 10.1186/s12918-015-0216-5. BMC Syst Biol. 2015. PMID: 26482604 Free PMC article.
-
A method for inverse bifurcation of biochemical switches: inferring parameters from dose response curves.BMC Syst Biol. 2014 Nov 20;8:114. doi: 10.1186/s12918-014-0114-2. BMC Syst Biol. 2014. PMID: 25409687 Free PMC article.
-
Network Pharmacology: Exploring the Resources and Methodologies.Curr Top Med Chem. 2018;18(12):949-964. doi: 10.2174/1568026618666180330141351. Curr Top Med Chem. 2018. PMID: 29600765 Review.
Cited by
-
Feedback-based, system-level properties of vertebrate-microbial interactions.PLoS One. 2013;8(2):e53984. doi: 10.1371/journal.pone.0053984. Epub 2013 Feb 20. PLoS One. 2013. PMID: 23437039 Free PMC article.
-
A comprehensive map of the influenza A virus replication cycle.BMC Syst Biol. 2013 Oct 2;7:97. doi: 10.1186/1752-0509-7-97. BMC Syst Biol. 2013. PMID: 24088197 Free PMC article.
-
Influenza virus-host interactomes as a basis for antiviral drug development.Curr Opin Virol. 2015 Oct;14:71-8. doi: 10.1016/j.coviro.2015.08.008. Epub 2015 Sep 13. Curr Opin Virol. 2015. PMID: 26364134 Free PMC article. Review.
-
Structure and dynamics of molecular networks: a novel paradigm of drug discovery: a comprehensive review.Pharmacol Ther. 2013 Jun;138(3):333-408. doi: 10.1016/j.pharmthera.2013.01.016. Epub 2013 Feb 4. Pharmacol Ther. 2013. PMID: 23384594 Free PMC article. Review.
-
3D Tissue-Engineered Vascular Drug Screening Platforms: Promise and Considerations.Front Cardiovasc Med. 2022 Mar 4;9:847554. doi: 10.3389/fcvm.2022.847554. eCollection 2022. Front Cardiovasc Med. 2022. PMID: 35310996 Free PMC article. Review.
References
Publication types
MeSH terms
Grants and funding
LinkOut - more resources
Full Text Sources
Research Materials

