

Sensitivity analysis of dynamic biological systems with time-delays
- PMID: 21106119
- PMCID: PMC2957680
- DOI: 10.1186/1471-2105-11-S7-S12
Sensitivity analysis of dynamic biological systems with time-delays
Abstract
Background: Mathematical modeling has been applied to the study and analysis of complex biological systems for a long time. Some processes in biological systems, such as the gene expression and feedback control in signal transduction networks, involve a time delay. These systems are represented as delay differential equation (DDE) models. Numerical sensitivity analysis of a DDE model by the direct method requires the solutions of model and sensitivity equations with time-delays. The major effort is the computation of Jacobian matrix when computing the solution of sensitivity equations. The computation of partial derivatives of complex equations either by the analytic method or by symbolic manipulation is time consuming, inconvenient, and prone to introduce human errors. To address this problem, an automatic approach to obtain the derivatives of complex functions efficiently and accurately is necessary.
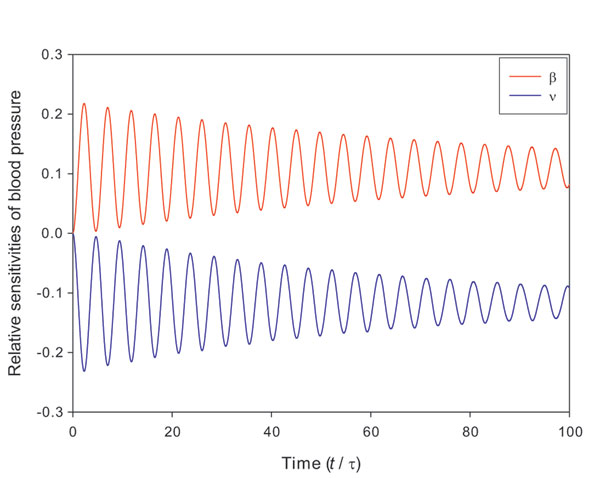
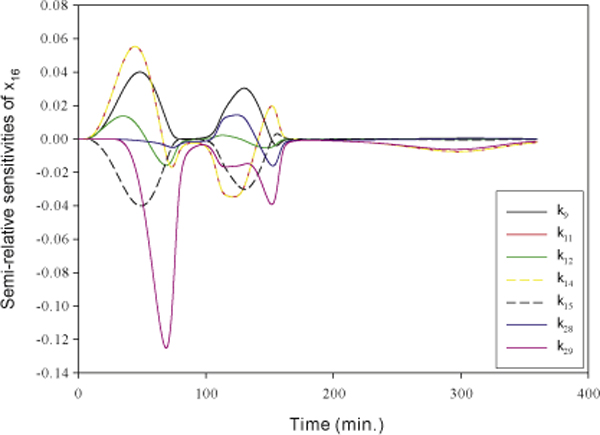
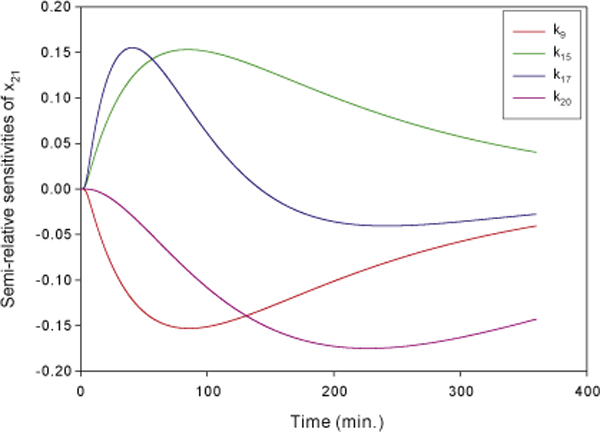
Results: We have proposed an efficient algorithm with an adaptive step size control to compute the solution and dynamic sensitivities of biological systems described by ordinal differential equations (ODEs). The adaptive direct-decoupled algorithm is extended to solve the solution and dynamic sensitivities of time-delay systems describing by DDEs. To save the human effort and avoid the human errors in the computation of partial derivatives, an automatic differentiation technique is embedded in the extended algorithm to evaluate the Jacobian matrix. The extended algorithm is implemented and applied to two realistic models with time-delays: the cardiovascular control system and the TNF-α signal transduction network. The results show that the extended algorithm is a good tool for dynamic sensitivity analysis on DDE models with less user intervention.
Conclusions: By comparing with direct-coupled methods in theory, the extended algorithm is efficient, accurate, and easy to use for end users without programming background to do dynamic sensitivity analysis on complex biological systems with time-delays.
Figures


Similar articles
-
Dynamic sensitivity analysis of biological systems.BMC Bioinformatics. 2008 Dec 12;9 Suppl 12(Suppl 12):S17. doi: 10.1186/1471-2105-9-S12-S17. BMC Bioinformatics. 2008. PMID: 19091016 Free PMC article.
-
A Parameter Estimation Method for Biological Systems modelled by ODE/DDE Models Using Spline Approximation and Differential Evolution Algorithm.IEEE/ACM Trans Comput Biol Bioinform. 2014 Nov-Dec;11(6):1066-76. doi: 10.1109/TCBB.2014.2322360. IEEE/ACM Trans Comput Biol Bioinform. 2014. PMID: 26357044
-
A reliable Taylor series-based computational method for the calculation of dynamic sensitivities in large-scale metabolic reaction systems: algorithm and software evaluation.Math Biosci. 2009 Dec;222(2):73-85. doi: 10.1016/j.mbs.2009.09.001. Epub 2009 Sep 9. Math Biosci. 2009. PMID: 19747493
-
Stochastic P systems and the simulation of biochemical processes with dynamic compartments.Biosystems. 2008 Mar;91(3):458-72. doi: 10.1016/j.biosystems.2006.12.009. Epub 2007 Jul 17. Biosystems. 2008. PMID: 17728055 Review.
-
Turing on Super-Turing and adaptivity.Prog Biophys Mol Biol. 2013 Sep;113(1):117-26. doi: 10.1016/j.pbiomolbio.2013.03.013. Epub 2013 Apr 10. Prog Biophys Mol Biol. 2013. PMID: 23583352 Review.
Cited by
-
Molecular Determinants Involved in Candida albicans Biofilm Formation and Regulation.Mol Biotechnol. 2024 Jul;66(7):1640-1659. doi: 10.1007/s12033-023-00796-x. Epub 2023 Jul 6. Mol Biotechnol. 2024. PMID: 37410258 Review.
-
Lessons from mathematically modeling the NF-κB pathway.Immunol Rev. 2012 Mar;246(1):221-38. doi: 10.1111/j.1600-065X.2011.01092.x. Immunol Rev. 2012. PMID: 22435558 Free PMC article. Review.
-
InCoB2010 - 9th International Conference on Bioinformatics at Tokyo, Japan, September 26-28, 2010.BMC Bioinformatics. 2010 Oct 15;11 Suppl 7(Suppl 7):S1. doi: 10.1186/1471-2105-11-S7-S1. BMC Bioinformatics. 2010. PMID: 21106116 Free PMC article.
References
-
- Fowler AC, Mackey MC. Relaxation oscillations in a class of delay differential equations. SIAM Journal on Applied Mathematics. 2002;11:299–323. doi: 10.1137/S0036139901393512. - DOI
-
- Bocharov GA, Rihan FA. Numerical modelling in biosciences using delay differential equations. Journal of Computational and Applied Mathematics. 2000;11(1-2):183–199. doi: 10.1016/S0377-0427(00)00468-4. - DOI
-
- Enright WH, Hayashi H. A delay differential equation solver based on a continuous Runge-Kutta method with defect control. Numerical Algorithms. 1997;11(3-4):349–364. doi: 10.1023/A:1019107718128. - DOI
Publication types
MeSH terms
Substances
LinkOut - more resources
Full Text Sources
