

Gradual transition from mosaic to global DNA methylation patterns during deuterostome evolution
- PMID: 21106124
- PMCID: PMC2957685
- DOI: 10.1186/1471-2105-11-S7-S2
Gradual transition from mosaic to global DNA methylation patterns during deuterostome evolution
Abstract
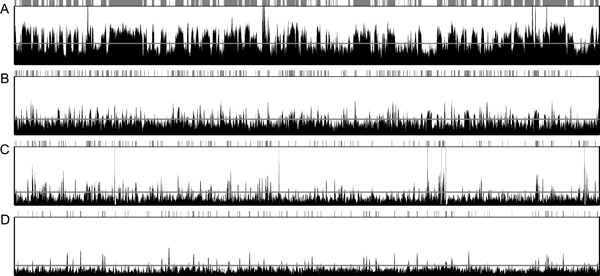
Background: DNA methylation by the Dnmt family occurs in vertebrates and invertebrates, including ascidians, and is thought to play important roles in gene regulation and genome stability, especially in vertebrates. However, the global methylation patterns of vertebrates and invertebrates are distinctive. Whereas almost all CpG sites are methylated in vertebrates, with the exception of those in CpG islands, the ascidian genome contains approximately equal amounts of methylated and unmethylated regions. Curiously, methylation status can be reliably estimated from the local frequency of CpG dinucleotides in the ascidian genome. Methylated and unmethylated regions tend to have few and many CpG sites, respectively, consistent with our knowledge of the methylation status of CpG islands and other regions in mammals. However, DNA methylation patterns and levels in vertebrates and invertebrates have not been analyzed in the same way.
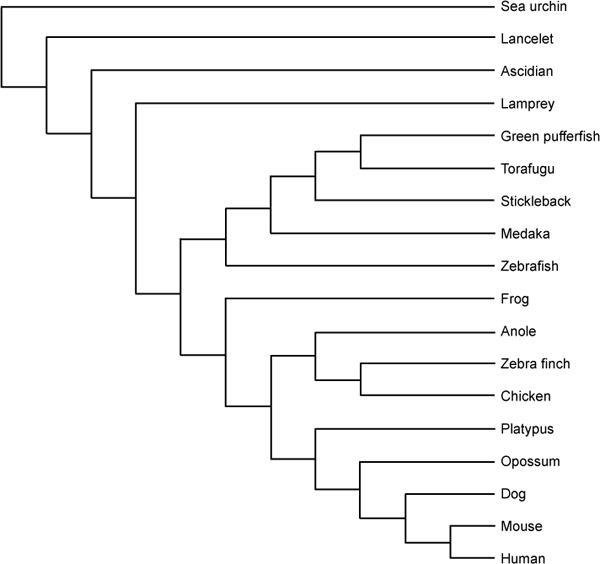
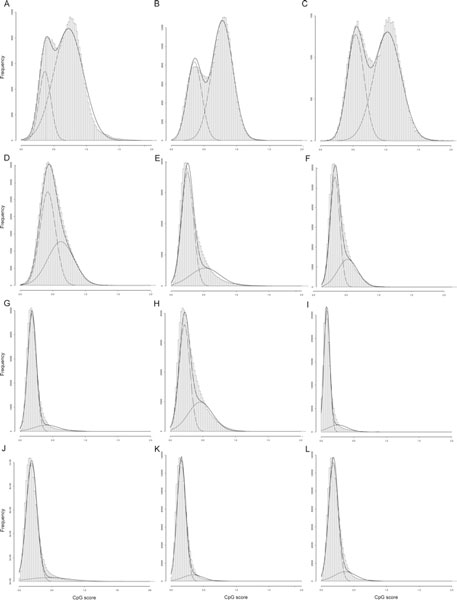
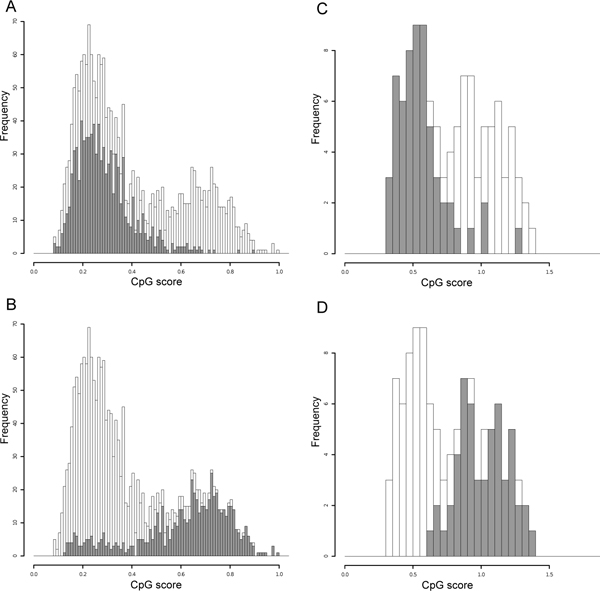
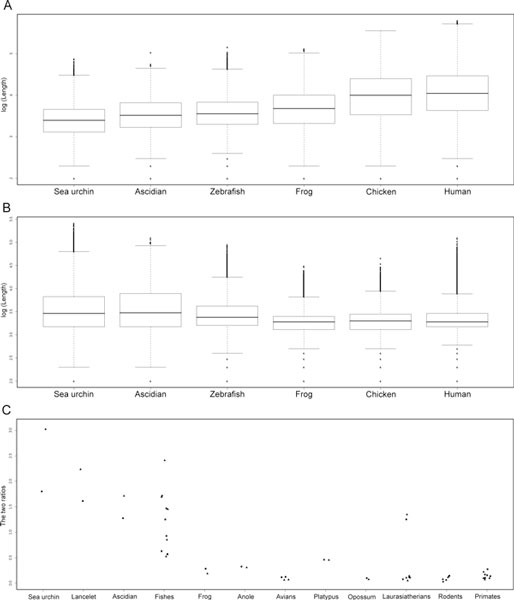
Results: Using a new computational methodology based on the decomposition of the bimodal distributions of methylated and unmethylated regions, we estimated the extent of the global methylation patterns in a wide range of animals. We then examined the epigenetic changes in silico along the phylogenetic tree. We observed a gradual transition from fractional to global patterns of methylation in deuterostomes, rather than a clear demarcation between vertebrates and invertebrates. When we applied this methodology to six piscine genomes, some of which showed features similar to those of invertebrates.
Conclusions: The mammalian global DNA methylation pattern was probably not acquired at an early stage of vertebrate evolution, but gradually expanded from that of a more ancient organism.
Figures
Similar articles
-
Profiling ascidian promoters as the primordial type of vertebrate promoter.BMC Genomics. 2011 Nov 30;12 Suppl 3(Suppl 3):S7. doi: 10.1186/1471-2164-12-S3-S7. Epub 2011 Nov 30. BMC Genomics. 2011. PMID: 22369359 Free PMC article.
-
Comparative genomic study reveals a transition from TA richness in invertebrates to GC richness in vertebrates at CpG flanking sites: an indication for context-dependent mutagenicity of methylated CpG sites.Genomics Proteomics Bioinformatics. 2008 Dec;6(3-4):144-54. doi: 10.1016/S1672-0229(09)60002-4. Genomics Proteomics Bioinformatics. 2008. PMID: 19329065 Free PMC article.
-
DNA methylation in amphioxus: from ancestral functions to new roles in vertebrates.Brief Funct Genomics. 2012 Mar;11(2):142-55. doi: 10.1093/bfgp/els009. Epub 2012 Mar 2. Brief Funct Genomics. 2012. PMID: 22389042 Review.
-
CpG dinucleotide frequencies reveal the role of host methylation capabilities in parvovirus evolution.J Virol. 2013 Dec;87(24):13816-24. doi: 10.1128/JVI.02515-13. Epub 2013 Oct 9. J Virol. 2013. PMID: 24109231 Free PMC article.
-
Patterns of DNA methylation in animals: an ecotoxicological perspective.Integr Comp Biol. 2014 Jul;54(1):77-86. doi: 10.1093/icb/icu025. Epub 2014 Apr 29. Integr Comp Biol. 2014. PMID: 24785828 Review.
Cited by
-
Pollution induces epigenetic effects that are stably transmitted across multiple generations.Evol Lett. 2022 Feb 3;6(2):118-135. doi: 10.1002/evl3.273. eCollection 2022 Apr. Evol Lett. 2022. PMID: 35386832 Free PMC article.
-
DNA methylomes and transcriptomes analysis reveal implication of host DNA methylation machinery in BmNPV proliferation in Bombyx mori.BMC Genomics. 2019 Oct 15;20(1):736. doi: 10.1186/s12864-019-6146-7. BMC Genomics. 2019. PMID: 31615392 Free PMC article.
-
InCoB2010 - 9th International Conference on Bioinformatics at Tokyo, Japan, September 26-28, 2010.BMC Bioinformatics. 2010 Oct 15;11 Suppl 7(Suppl 7):S1. doi: 10.1186/1471-2105-11-S7-S1. BMC Bioinformatics. 2010. PMID: 21106116 Free PMC article.
-
Uncovering the novel characteristics of Asian honey bee, Apis cerana, by whole genome sequencing.BMC Genomics. 2015 Jan 2;16(1):1. doi: 10.1186/1471-2164-16-1. BMC Genomics. 2015. PMID: 25553907 Free PMC article.
-
Diversification of CpG-Island Promoters Revealed by Comparative Analysis Between Human and Rhesus Monkey Genomes.Mamm Genome. 2020 Aug;31(7-8):240-251. doi: 10.1007/s00335-020-09844-2. Epub 2020 Jul 9. Mamm Genome. 2020. PMID: 32647942 Free PMC article.
References
-
- Bird AP. CpG island as gene markers in the vertebrate nucleus. Trends Genet. 1987;3:342–347. doi: 10.1016/0168-9525(87)90294-0. - DOI
Publication types
MeSH terms
LinkOut - more resources
Full Text Sources
