. 2011 Mar;39(4):e20.
doi: 10.1093/nar/gkq1196. Epub 2010 Nov 23.

Real time monitoring of endogenous cytoplasmic mRNA using linear antisense 2'-O-methyl RNA probes in living cells

Affiliations

Real time monitoring of endogenous cytoplasmic mRNA using linear antisense 2'-O-methyl RNA probes in living cells

Kohki Okabe et al. Nucleic Acids Res. 2011 Mar.

Abstract

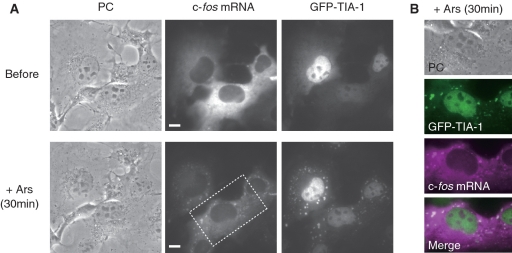
Visualization and monitoring of endogenous mRNA in the cytoplasm of living cells promises a significant comprehension of refined post-transcriptional regulation. Fluorescently labeled linear antisense oligonucleotides can bind to natural mRNA in a sequence-specific way and, therefore, provide a powerful tool in probing endogenous mRNA. Here, we investigated the feasibility of using linear antisense probes to monitor the variable and dynamic expression of endogenous cytoplasmic mRNAs. Two linear antisense 2'-O-methyl RNA probes, which have different interactive fluorophores at the 5'-end of one probe and at the 3'-end of the other, were used to allow fluorescence resonance energy transfer (FRET) upon hybridization to the target mRNA. By characterizing the formation of the probe-mRNA hybrids in living cells, we found that the probe composition and concentration are crucial parameters in the visualization of endogenous mRNA with high specificity. Furthermore, rapid hybridization (within 1 min) of the linear antisense probe enabled us to visualize dynamic processes of endogenous c-fos mRNA, such as fast elevation of levels after gene induction and the localization of c-fos mRNA in stress granules in response to cellular stress. Thus, our approach provides a basis for real time monitoring of endogenous cytoplasmic mRNA in living cells.


Figures

Figure 1.
Figure 1.
Hybridization of antisense probes with the target mRNA. (A) Schematic drawing of mRNA detection. When two kinds of fluorescently labeled antisense probes are hybridized to adjacent sequences of the target mRNA, the distance between the two fluorophores becomes short and FRET occurs. (B) The fluorescence spectra of fluorescently labeled probes containing 2′OMeRNA or DNA backbones in the absence (gray line) or presence (red line) of the target c-fos mRNA, prepared by an in vitro transcription system. FRET was observed when mRNA hybridized with antisense probes; in contrast, FRET was not detected when using linear sense probes.
Figure 2.
Figure 2.
Antisense 2′OMeRNA probes can form a stable complex with mRNA in living cells whereas antisense ODN probes cannot. (A–C) PC images and fluorescence images of the mRNA complex that was hybridized with probes in vitro and then microinjected into the cytoplasm of living COS7 cells; Antisense ODN probes (A), antisense 2′OMeRNA probes (B) and sense 2′OMeRNA probes (C). D, F and A in each image indicate donor image, FRET image and acceptor image, respectively. Scale bars, 10 µm.
Figure 3.
Figure 3.
The detection of endogenous c-fos mRNA in the cytoplasm of living cells using streptavidin-bound antisense 2′OMeRNA probes. (A) Fluorescence images of streptavidin-bound 2′OMeRNA probes microinjected into the cytoplasm of COS7 cells. When antisense probes were introduced, strong fluorescence due to FRET was observed, while no fluorescence was detected when sense probes or ODN probes were introduced. D, F and A in each image indicate donor image, FRET image and acceptor image, respectively. Scale bars, 10 µm. (B) Relationship between FRET signal and probe concentration. FRET signal, defined as the ratio of the fluorescence intensity of the FRET image (FFRET) to that of the donor probe (Fdonor) in each cell, was plotted against the probe concentration inside the cytoplasm. The probe concentration was determined from the total fluorescence intensities inside cells using the calibration curve of fluorescence intensities and probe concentration measured by FCS. Results obtained for paired antisense 2′OMeRNA probes, control 2′OMeRNA probes (sense donor probe and antisense acceptor probe), paired antisense ODN probes and the hybrid paired probes (antisense ODN donor probe and antisense 2′OMeRNA acceptor probe) were compared. Closed red circles indicate antisense 2′OMeRNA probe, open red circles indicate control sense 2′OMeRNA probe, open blue circles indicate antisense ODN probe and open black circles indicate the hybrid paired probes.
Figure 4.
Figure 4.
Hybridization time course studies of antisense probes with mRNA. Cases using linear antisense 2′OMeRNA probes in a 1×SSC solution (A), MB in a 1×SSC solution (B), streptavidin-bound linear antisense 2′OMeRNA probes in living COS7 cells (C) and streptavidin-bound MB in living COS7 cells (D) are presented. A c-fos mRNA prepared by in vitro transcription and the endogenously expressed c-fos mRNA in the cytoplasm of living COS7 cells was targeted in (A and B) and (C and D), respectively. The concentration of mRNA and antisense probes was 50 nM in a 1×SSC solution (A and B). In living cell studies, 3 µM of probes (in a microinjection needle) were introduced into the cell (C and D). The estimated concentration of probes inside the cell is ∼0.5 µM. The time course plots were fitted to a single-exponential function of the time constant (t) for the hybridization reaction in each case (red fit line for linear antisense probe and blue fit line for MB). Error bas in (C and D) represent SD.
Figure 5.
Figure 5.
Real time monitoring of endogenous c-fos mRNA induction. Normalized FRET fluorescence from streptavidin-bound linear antisense 2′OMeRNA probes was recorded over time. Red line indicates the result from PMA-treated COS7 cells and gray line indicates the result from COS7 cells treated with diluents (0.0001% DMSO). The probe concentration inside the cell was 12 ± 4.8 µM (five cells). Error bars represent SD.
Figure 6.
Figure 6.
The real time imaging of endogenous c-fos mRNA in SGs. (A) PC and fluorescence images of endogenous c-fos mRNA and GFP-TIA1 in COS7 cells before and 30 min after arsenite treatment. Endogenous c-fos mRNA was visualized by acquiring FRET fluorescence from streptavidin-bound linear antisense 2′OMeRNA probes. The probe concentration inside the cell was 0.76 ± 0.24 µM. (B) Co-localization of TIA-1 (green) and endogenous c-fos mRNA (magenta) in SGs. Images of cells are enlarged from boxed area in (A). Scale bars, 10 µm.

References

    1. Anderson P, Kedarsha N. RNA granules: post transcriptional and epigenetic modulators of gene expression. Nat. Rev. Mol. Cell Biol. 2009;10:430–436. - PubMed
    1. Bushati N, Cohen SM. microRNA functions. Annu. Rev. Cell Dev. Biol. 2009;23:75–105. - PubMed
    1. Chekulaeva M, Filipowicz W. Mechanism of miRNA-mediated post-transcriptional regulation in animal cells. Curr. Opin. Cell Biol. 2009;21:452–460. - PubMed
    1. Dirks RW, Tanke HJ. Advances in fluorescent tracking of nucleic acids in living cells. Biotechniques. 2006;40:489–496. - PubMed
    1. Bao G, Rhee WJ, Tsourkas A. Fluorescence probes for live-cell RNA detection. Annu. Rev. Biomed. Eng. 2009;11:25–47. - PMC - PubMed

Publication types