

A new role for heme, facilitating release of iron from the bacterioferritin iron biomineral
- PMID: 21106523
- PMCID: PMC3030353
- DOI: 10.1074/jbc.M110.175034
A new role for heme, facilitating release of iron from the bacterioferritin iron biomineral
Abstract
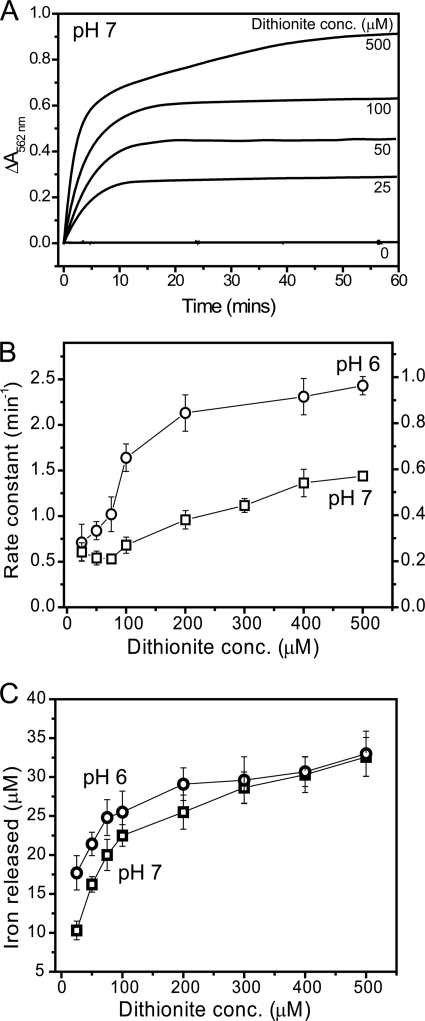
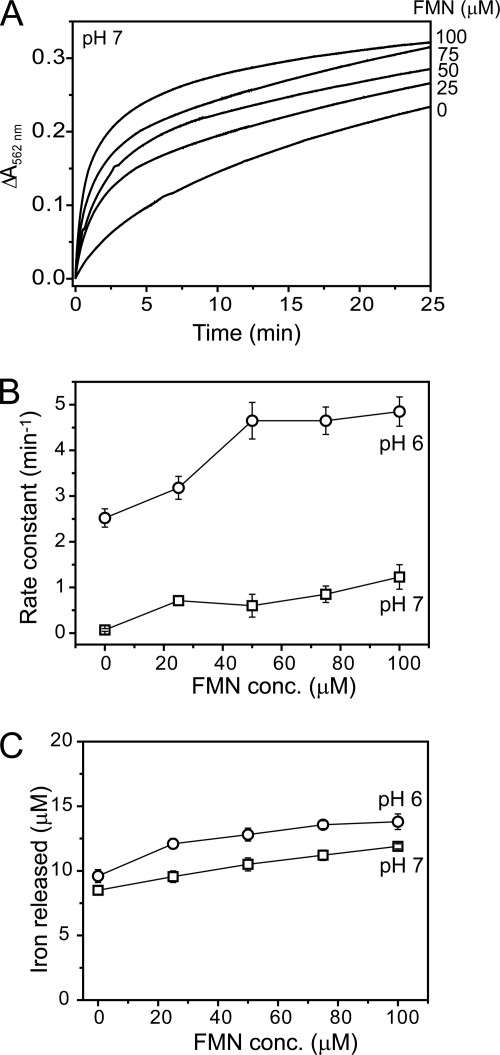
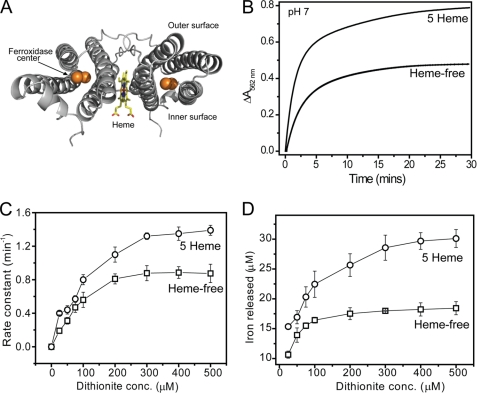
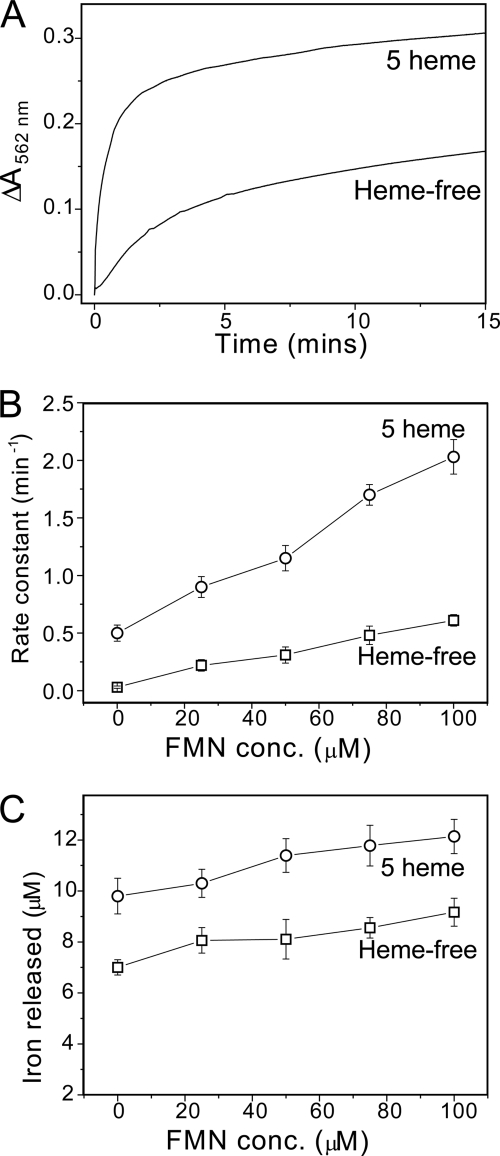
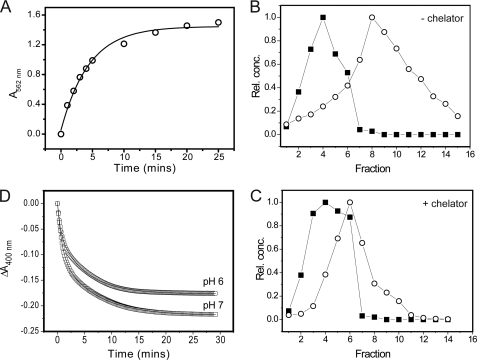
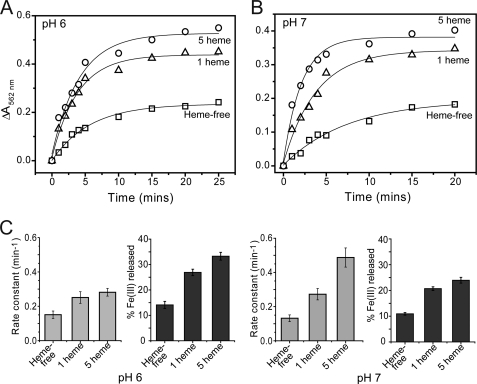
Bacterioferritin (BFR) from Escherichia coli is a member of the ferritin family of iron storage proteins and has the capacity to store very large amounts of iron as an Fe(3+) mineral inside its central cavity. The ability of organisms to tap into their cellular stores in times of iron deprivation requires that iron must be released from ferritin mineral stores. Currently, relatively little is known about the mechanisms by which this occurs, particularly in prokaryotic ferritins. Here we show that the bis-Met-coordinated heme groups of E. coli BFR, which are not found in other members of the ferritin family, play an important role in iron release from the BFR iron biomineral: kinetic iron release experiments revealed that the transfer of electrons into the internal cavity is the rate-limiting step of the release reaction and that the rate and extent of iron release were significantly increased in the presence of heme. Despite previous reports that a high affinity Fe(2+) chelator is required for iron release, we show that a large proportion of BFR core iron is released in the absence of such a chelator and further that chelators are not passive participants in iron release reactions. Finally, we show that the catalytic ferroxidase center, which is central to the mechanism of mineralization, is not involved in iron release; thus, core mineralization and release processes utilize distinct pathways.
Figures
Similar articles
-
Bacterioferritin: Structure, Dynamics, and Protein-Protein Interactions at Play in Iron Storage and Mobilization.Acc Chem Res. 2017 Feb 21;50(2):331-340. doi: 10.1021/acs.accounts.6b00514. Epub 2017 Feb 8. Acc Chem Res. 2017. PMID: 28177216 Free PMC article.
-
Fe-haem bound to Escherichia coli bacterioferritin accelerates iron core formation by an electron transfer mechanism.Biochem J. 2012 Jun 15;444(3):553-60. doi: 10.1042/BJ20112200. Biochem J. 2012. PMID: 22458666
-
Two distinct ferritin-like molecules in Pseudomonas aeruginosa: the product of the bfrA gene is a bacterial ferritin (FtnA) and not a bacterioferritin (Bfr).Biochemistry. 2011 Jun 14;50(23):5236-48. doi: 10.1021/bi2004119. Epub 2011 May 20. Biochemistry. 2011. PMID: 21574546 Free PMC article.
-
Iron storage in bacteria.Adv Microb Physiol. 1998;40:281-351. doi: 10.1016/s0065-2911(08)60134-4. Adv Microb Physiol. 1998. PMID: 9889981 Review.
-
Bacterioferritin nanocage: Structure, biological function, catalytic mechanism, self-assembly and potential applications.Biotechnol Adv. 2022 Dec;61:108057. doi: 10.1016/j.biotechadv.2022.108057. Epub 2022 Nov 1. Biotechnol Adv. 2022. PMID: 36328189 Review.
Cited by
-
Sequestration and scavenging of iron in infection.Infect Immun. 2013 Oct;81(10):3503-14. doi: 10.1128/IAI.00602-13. Epub 2013 Jul 8. Infect Immun. 2013. PMID: 23836822 Free PMC article.
-
Bacterioferritin: Structure, Dynamics, and Protein-Protein Interactions at Play in Iron Storage and Mobilization.Acc Chem Res. 2017 Feb 21;50(2):331-340. doi: 10.1021/acs.accounts.6b00514. Epub 2017 Feb 8. Acc Chem Res. 2017. PMID: 28177216 Free PMC article.
-
Mechanism of ferrous iron binding and oxidation by ferritin from a pennate diatom.J Biol Chem. 2013 May 24;288(21):14917-25. doi: 10.1074/jbc.M113.454496. Epub 2013 Apr 2. J Biol Chem. 2013. PMID: 23548912 Free PMC article.
-
Iron binding at specific sites within the octameric HbpS protects streptomycetes from iron-mediated oxidative stress.PLoS One. 2013 Aug 27;8(8):e71579. doi: 10.1371/journal.pone.0071579. eCollection 2013. PLoS One. 2013. PMID: 24013686 Free PMC article.
-
The Iron-Sulfur Cluster of Bacterioferritin-Associated Ferredoxin (Bfd): a "Biological Fuse" that Prevents Oxidative Damage to Cells?Angew Chem Int Ed Engl. 2025 Aug 18;64(34):e202511340. doi: 10.1002/anie.202511340. Epub 2025 Jun 25. Angew Chem Int Ed Engl. 2025. PMID: 40531653 Free PMC article.
References
-
- Andrews S. C. (1998) Adv. Microb. Physiol. 40, 281–351 - PubMed
-
- Harrison P. M., Arosio P. (1996) Biochim. Biophys. Acta 1275, 161–203 - PubMed
-
- Theil E. C., Matzapetakis M., Liu X. F. (2006) J. Biol. Inorg. Chem. 11, 803–810 - PubMed
-
- Chasteen N. D. (1998) Ferritin. Uptake, storage, and release of iron. in Metal Ions Biol. Syst. 35, 479–514 - PubMed
-
- Lewin A., Moore G. R., Le Brun N. E. (2005) Dalton Trans. 3597–3610 - PubMed
Publication types
MeSH terms
Substances
Grants and funding
LinkOut - more resources
Full Text Sources
Medical
Molecular Biology Databases
Miscellaneous
