. 2011 Feb 4;286(5):3460-72.
doi: 10.1074/jbc.M110.161109. Epub 2010 Nov 24.

Disruption of the acyl-CoA-binding protein gene delays hepatic adaptation to metabolic changes at weaning

Affiliations

Disruption of the acyl-CoA-binding protein gene delays hepatic adaptation to metabolic changes at weaning

Ditte Neess et al. J Biol Chem. .

Abstract

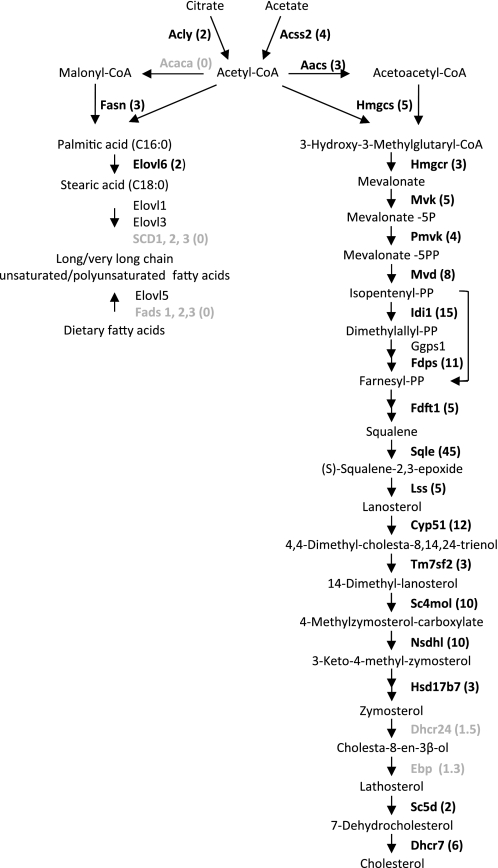
The acyl-CoA-binding protein (ACBP)/diazepam binding inhibitor is an intracellular protein that binds C(14)-C(22) acyl-CoA esters and is thought to act as an acyl-CoA transporter. In vitro analyses have indicated that ACBP can transport acyl-CoA esters between different enzymatic systems; however, little is known about the in vivo function in mammalian cells. We have generated mice with targeted disruption of ACBP (ACBP(-/-)). These mice are viable and fertile and develop normally. However, around weaning, the ACBP(-/-) mice go through a crisis with overall weakness and a slightly decreased growth rate. Using microarray analysis, we show that the liver of ACBP(-/-) mice displays a significantly delayed adaptation to weaning with late induction of target genes of the sterol regulatory element-binding protein (SREBP) family. As a result, hepatic de novo cholesterogenesis is decreased at weaning. The delayed induction of SREBP target genes around weaning is caused by a compromised processing and decreased expression of SREBP precursors, leading to reduced binding of SREBP to target sites in chromatin. In conclusion, lack of ACBP interferes with the normal metabolic adaptation to weaning and leads to delayed induction of the lipogenic gene program in the liver.


Figures

FIGURE 1.
FIGURE 1.
Targeting strategy and validation of ACBP knock-out. Targeting of the Acbp gene (a) was performed using a sequence replacement vector (b), which contained a cassette for negative selection with gancyclovir (thymidine kinase gene (Tk) under control of the Pgk1 promoter) upstream of the region of homology and a cassette for positive selection with neomycin (loxP-flanked neomycin resistance cassette under the control of the PGK-1 promoter) replacing the Acbp exon 2 and parts of introns 1 and 2. Homologous recombination results in the targeted Acbp allele (c). Acbp mRNA (d) and protein (e) expressions in liver tissue from ACBP+/+, ACBP+/−, and ACBP−/− male mice were determined. RNA data are presented as the mean of six individuals with indication of S.E. (error bars). Protein was analyzed as pools of three individuals in each group. Immunohistochemistry on liver sections is representative of three ACBP+/+ (f–i) and ACBP−/− (j and k) individuals in each group. Hematoxylin was used for background/nuclear staining of sections h–k.
FIGURE 2.
FIGURE 2.
ACBP−/− mice have decreased weight gain immediately after weaning. a, the weight of male and female ACBP+/+ (n = 28) and ACBP−/− (n = 15) pups was determined every second day during the first 5 weeks of their life and subsequently every fourth day. The pups were weaned at day 21 and housed in groups of 4–7 mice/cage. Multivariate analysis of variance was used to compare ACBP−/− with ACBP+/+ at the same age, and significance level was p = 0.05. *, difference between the two genotypes at the same age. b, plasma insulin was determined in fed ACBP−/− (n = 14) and ACBP+/+ (n = 20) mice at 21 days of age. There is no significant difference between ACBP−/− and ACBP+/+ plasma insulin. Unpaired Student's t test (parametric) was used. Significance level was p = 0.05. Error bars, S.E.
FIGURE 3.
FIGURE 3.
Disruption of ACBP leads to deregulation of SREBP target genes in the liver at day 21. RNA was isolated from ACBP+/+ (n = 15) and ACBP−/− (n = 15) livers at day 21, and equal amounts of RNA from five individuals in each group were pooled. The six pools of liver RNA (three from ACBP+/+ and three from ACBP−/−) were processed as described under “Materials and Methods.” The genes shown in boldface black type are all SREBP target genes, which are expressed at least 2-fold lower in ACBP−/− (fold change indicated in parentheses), and the genes shown in boldface gray type are SREBP target genes, which are unchanged or expressed less than 2-fold lower in ACBP−/− than in ACBP+/+ liver according to the microarray. Genes shown in normal black type are non-SREBP target genes. Aacs, acetoacetyl-CoA synthetase; Acaca, acetyl-CoA carboxylase α; Acly, ATP citrate lyase; Acss2, acetyl-coenzyme A synthetase; Cyp51, cytochrome P450, family 51; Dhcr, dehydrocholesterol reductase; Ebp, emopamil-binding protein; Elovl, elongation of very long chain fatty acids protein; Fads, fatty acid desaturase; Fasn, fatty acid synthase; Fdft1, farnesyl diphosphate farnesyltransferase; Fdps, farnesyl diphosphate synthase; Ggps1, geranylgeranyl pyrophosphate synthetase; Hmgcr, 3-hydroxy-3-methylglutaryl-coenzyme A reductase; Hmgcs, 3-hydroxy-3-methylglutaryl-coenzyme A synthase; Hsd17b7, hydroxysteroid (17-β) dehydrogenase 7; Idi, isopentenyl-diphosphate δ-isomerase; Lss, lanosterol synthase; Mvd, mevalonate (diphospho) decarboxylase; Mvk, mevalonate kinase; Nsdhl, NAD(P)-dependent steroid dehydrogenase-like; Pmvk, phosphomevalonate kinase; Sc4mol, sterol-C4-methyl oxidase-like; Sc5d, sterol-C5-desaturase; Scd, stearoyl-CoA desaturase; Sqle, squalene epoxidase; Tm7sf2, transmembrane 7 superfamily member 2.
FIGURE 4.
FIGURE 4.
Induction of SREBP target gene expression during weaning is delayed in ACBP−/− liver. a, RNA was isolated from ACBP−/− and ACBP+/+ mice livers of 6–20 individuals at each age, 16, 19, 21, 23, 28, 35, and 90 days, and cDNA was prepared and analyzed by real-time PCR as described under “Materials and Methods.” Real-time PCR was run on individual samples and shown as mean with indications of S.E. (error bars). Two-way analysis of variance was used to compare ACBP−/− with ACBP+/+ within the same age group; significance level was p = 0.05 (seven pairwise comparisons; p = 0.0071). *, significant differences between the two genotypes at the same age. b, protein was extracted from the livers of ACBP−/− and ACBP+/+ mice at day 16, 19, 21, 23, 28, and 35 of age. Equal amounts of protein from a minimum of 10 individuals in each group was pooled and separated by SDS-PAGE as described under “Materials and Methods.” FAS and HMGCR protein levels were determined by Western blotting and ECL detection by use of specific antibodies. TFIIB was used as a control for equal loading.
FIGURE 5.
FIGURE 5.
SREBP-2 mRNA and protein levels are decreased in ACBP−/− liver at weaning. The mRNA expression levels of Srebp-1c (a) and -2 (b) in the liver of ACBP+/+ and ACBP−/− mice were investigated by real-time PCR run on individual samples and shown as the mean with indications of S.E. (error bars). Two-way analysis of variance was used to compare ACBP−/− with ACBP+/+ at the same age, and significance level was p = 0.05 (seven pairwise comparisons; p = 0.0071). *, difference between the two genotypes at the same age. The levels of pSREBP-1 (c) and -2 (d) were determined in livers of ACBP−/− and ACBP+/+ mice with 10–20 individuals at each of the ages, 16, 19, 21, 23, 28, and 35 days. e and f, nuclear extracts were made from the livers of three ACBP−/− and three ACBP+/+ individuals at 21 days of age and analyzed for nSREBP-1 and -2 level as described under “Materials and Methods.” Each lane represents a pool of three individuals. As a control for nSREBP-1 and -2, we have used liver from fasted/refed (RF) and from lovastatin/Zetia-fed (LZ) mice, respectively. g, SREBP-2 binding to well established target sites in the Acly, Acss2, and Hmgcr loci was quantified by ChIP-PCR on liver tissue from six ACBP−/− and six ACBP+/+ male mice at 21 days of age. The background regions (BG1 and BG2) are regions that do not bind nSREBP-2. Unpaired t test (parametric) was used, and significance level was p = 0.05.
FIGURE 6.
FIGURE 6.
De novo synthesis of hepatic cholesterol is inhibited in ACBP−/− mice at day 21. Hepatic de novo synthesis of cholesterol (a) and TAG (b) was determined after i.p. injection of [14C]acetic acid into 21-day-old ACBP−/− (n = 8) and ACBP+/+ (n = 7) mice. One hour following injection, mice were euthanized. Lipids were extracted and analyzed as described under “Materials and Methods.” Data are shown as the mean with indication of S.E. (error bars). Unpaired t test (parametric) was used, and significance level was p = 0.05.
FIGURE 7.
FIGURE 7.
Hepatic levels of TAG and CE are increased in ACBP−/− mice at weaning. Levels of free hepatic cholesterol (a), CE (b), and TAG (c) in ACBP−/− and ACBP+/+ livers at days 16–35 were determined by use of TLC and different enzymatic assays as described under “Materials and Methods.” The data shown represent mean of eight individuals with indication of S.E. (error bars). Two-way analysis of variance was used to compare ACBP−/− with ACBP+/+ at the same age, and significance level was p = 0.05 (six pairwise comparisons; p = 0.0083). *, difference between the two genotypes at the same age.
FIGURE 8.
FIGURE 8.
Acyl-CoA ester levels are reduced in livers from ACBP−/− mice at weaning. The total amount of acyl-CoA esters (a) and the distribution of acyl-CoA esters into different species (b) were determined using HPLC as described under “Materials and Methods.” These data represent the mean value of eight individuals of each genotype and are shown with indications of S.E. (error bars). Unpaired t test (parametric) was used, and significance level was p = 0.05.
FIGURE 9.
FIGURE 9.
Plasma cholesterol levels are elevated in ACBP−/− mice at day 21. The amounts of total plasma cholesterol (a) and plasma TAG (b) at day 21 were determined as described under “Materials and Methods.” The TAG analysis (b) is given as a concentration of glycerol, which is proportional to the TAG concentration. The data shown represent the mean of 9–11 individuals in each group with indication of S.E. (error bars) Unpaired t test (parametric) was used, and significance level was p = 0.05.

Similar articles

Cited by

References

    1. Burton M., Rose T. M., Faergeman N. J., Knudsen J. (2005) Biochem. J. 392, 299–307 - PMC - PubMed
    1. Faergeman N. J., Wadum M., Feddersen S., Burton M., Kragelund B. B., Knudsen J. (2007) Mol. Cell. Biochem. 299, 55–65 - PubMed
    1. Mandrup S., Andreasen P. H., Knudsen J., Kristiansen K. (1993) Mol. Cell. Biochem. 123, 55–61 - PubMed
    1. Mandrup S., Hummel R., Ravn S., Jensen G., Andreasen P. H., Gregersen N., Knudsen J., Kristiansen K. (1992) J. Mol. Biol. 228, 1011–1022 - PubMed
    1. Neess D., Kiilerich P., Sandberg M. B., Helledie T., Nielsen R., Mandrup S. (2006) Mol. Cell. Biochem. 284, 149–157 - PubMed

Publication types