. 2011 Jun 22;278(1713):1823-30.
doi: 10.1098/rspb.2010.1295. Epub 2010 Nov 24.

Global analysis of thermal tolerance and latitude in ectotherms

Affiliations

Global analysis of thermal tolerance and latitude in ectotherms

Jennifer M Sunday et al. Proc Biol Sci. .

Abstract

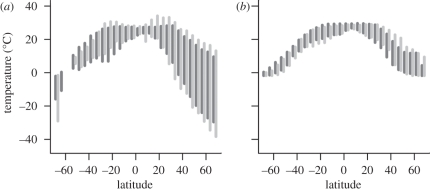
A tenet of macroecology is that physiological processes of organisms are linked to large-scale geographical patterns in environmental conditions. Species at higher latitudes experience greater seasonal temperature variation and are consequently predicted to withstand greater temperature extremes. We tested for relationships between breadths of thermal tolerance in ectothermic animals and the latitude of specimen location using all available data, while accounting for habitat, hemisphere, methodological differences and taxonomic affinity. We found that thermal tolerance breadths generally increase with latitude, and do so at a greater rate in the Northern Hemisphere. In terrestrial ectotherms, upper thermal limits vary little while lower thermal limits decrease with latitude. By contrast, marine species display a coherent poleward decrease in both upper and lower thermal limits. Our findings provide comprehensive global support for hypotheses generated from studies at smaller taxonomic subsets and geographical scales. Our results further indicate differences between terrestrial and marine ectotherms in how thermal physiology varies with latitude that may relate to the degree of temperature variability experienced on land and in the ocean.


Figures

Figure 1.
Figure 1.
Range of surface temperatures for (a) land and (b) sea. Bars indicate the inner 95% quantile of mean monthly temperatures from long-term climatologies, sampled over all longitudes, on a 5° × 5° grid basis (land: 1961–1990 [26]; sea: 1960–1989 [27]). (a) Data from New World (North and South America, and adjacent polar regions) and Old World (other continents and adjacent polar regions) land areas are shown separately (dark and light grey bars, respectively). Data from the Pacific Ocean (and adjacent Southern Ocean and polar waters) and combined Atlantic and Indian Oceans (and adjacent Southern Ocean and polar waters) are shown separately (dark and light grey bars, respectively).
Figure 2.
Figure 2.
Thermal tolerance limits of ectotherms (a) by taxonomic group, and for (b) terrestrial and (c) marine species. Grey lines link paired upper (triangles) and lower (circles) thermal tolerance limits of species by collection location, corrected for altitude (see text). Crosses indicate cold tolerances estimated by the freezing point of sea water. Southern latitudes are represented by negative x-axis values. Yellow, amphibian; green, reptile; pink, terrestrial arthropod; navy blue, mollusc; sky blue, fish; black, marine arthropod.
Figure 3.
Figure 3.
Thermal tolerance breadth (TTB) by latitude of specimen collection for (a) terrestrial and (b) marine species. Points indicate studies in which upper and lower thermal limits were measured after acclimation to different temperatures (black; n = 129) or to the same temperature (grey; n = 188). Crosses indicate TTBs bounded by the freezing point of sea water. Best-fit regression lines for each habitat and hemisphere from the linear mixed-effects model, accounting for acclimation history and taxonomic affinity (table 1) are shown; solid lines represent relationships significantly different from zero. Latitudes of collection are corrected for altitude (see text).
Figure 4.
Figure 4.
Upper and lower thermal tolerance limits by absolute latitude of collection, for (a) terrestrial and (b) marine species. Points indicate upper (triangles) and lower (circles) tolerance limits. Data not included in the linear model are in grey, crosses indicate cold limits estimated by the freezing point of sea water. Best-fit regression lines from linear mixed-effects model are shown. Latitudes of collection are corrected for altitude (see text).

References

    1. Gaston K. J., et al. 2009. Macrophysiology: a conceptual reunification. Am. Nat. 174, 595–61210.1086/605982 (doi:10.1086/605982) - DOI - DOI - PubMed
    1. Ghalambor C. K., Huey R. B., Martin P. R., Tewksbury J. J., Wang G. 2006. Are mountain passes higher in the tropics? Janzen's hypothesis revisited. Integr. Comp. Biol. 46, 5–1710.1093/icb/icj003 (doi:10.1093/icb/icj003) - DOI - DOI - PubMed
    1. Dobzhansky T. 1950. Evolution in the tropics. Am. Sci. 38, 209–221
    1. Janzen D. H. 1967. Why mountain passes are higher in the tropics. Am. Nat. 101, 233–24910.1086/282487 (doi:10.1086/282487) - DOI - DOI
    1. Chown S. L., Gaston K. J., Robinson D. 2004. Macrophysiology: large-scale patterns in physiological traits and their ecological implications. Funct. Ecol. 18, 159–16710.1111/j.0269-8463.2004.00825.x (doi:10.1111/j.0269-8463.2004.00825.x) - DOI - DOI

Publication types