. 2011 Feb 15;17(4):907-17.
doi: 10.1158/1078-0432.CCR-10-1762. Epub 2010 Nov 24.

Tumor regression and growth rates determined in five intramural NCI prostate cancer trials: the growth rate constant as an indicator of therapeutic efficacy

Affiliations

Tumor regression and growth rates determined in five intramural NCI prostate cancer trials: the growth rate constant as an indicator of therapeutic efficacy

Wilfred D Stein et al. Clin Cancer Res. .

Abstract

Purpose: In solid tumors such as prostate cancer, novel paradigms are needed to assess therapeutic efficacy. We utilized a method estimating tumor growth and regression rate constants from serial PSA measurements, and assessed its potential in patients with metastatic castration resistant prostate carcinoma (mCRPC).

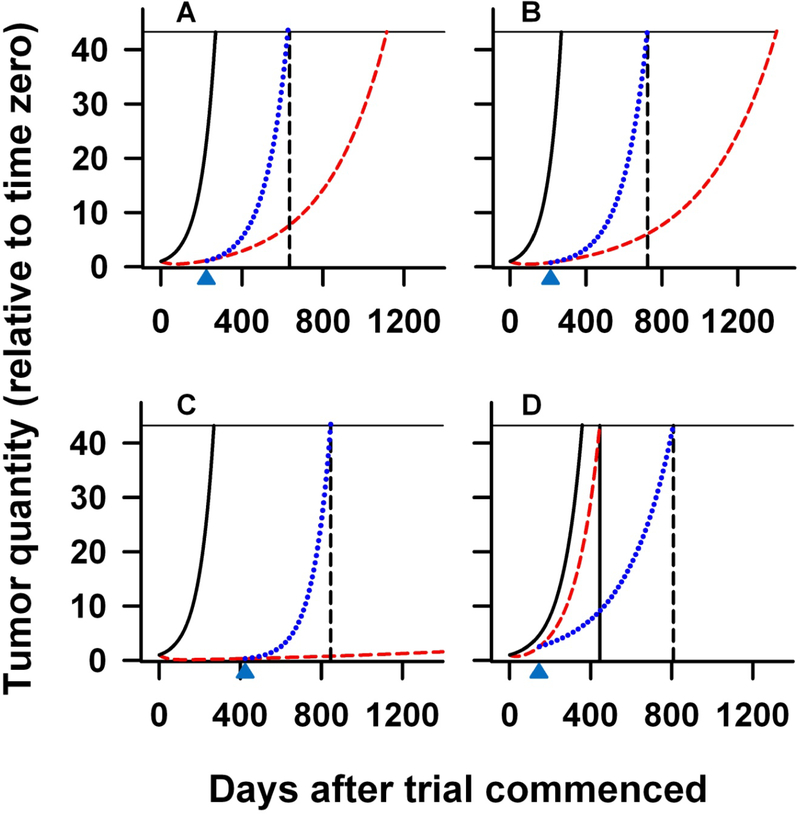
Experimental design: Patients were enrolled in five phase II studies, including an experimental vaccine trial, representing the evolution of therapy in mCRPC. PSA measurements obtained before, and during, therapy were used. Data analysis using a two-phase mathematical equation yielded concomitant PSA growth and regression rate constants.

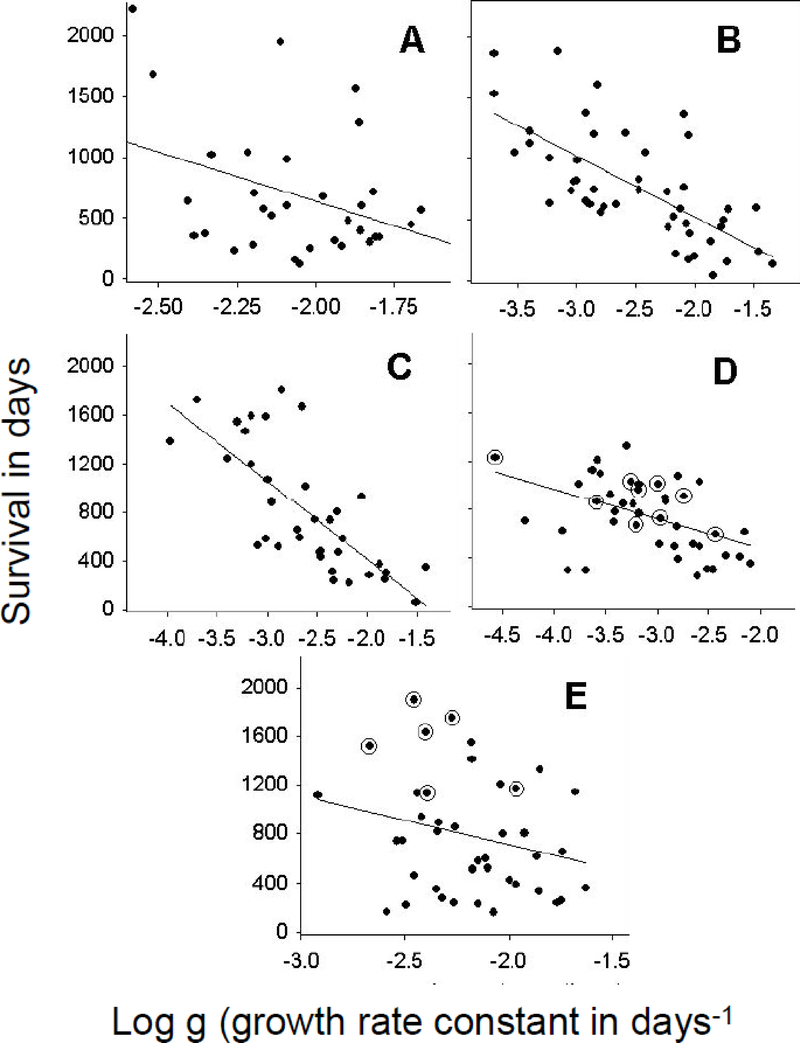
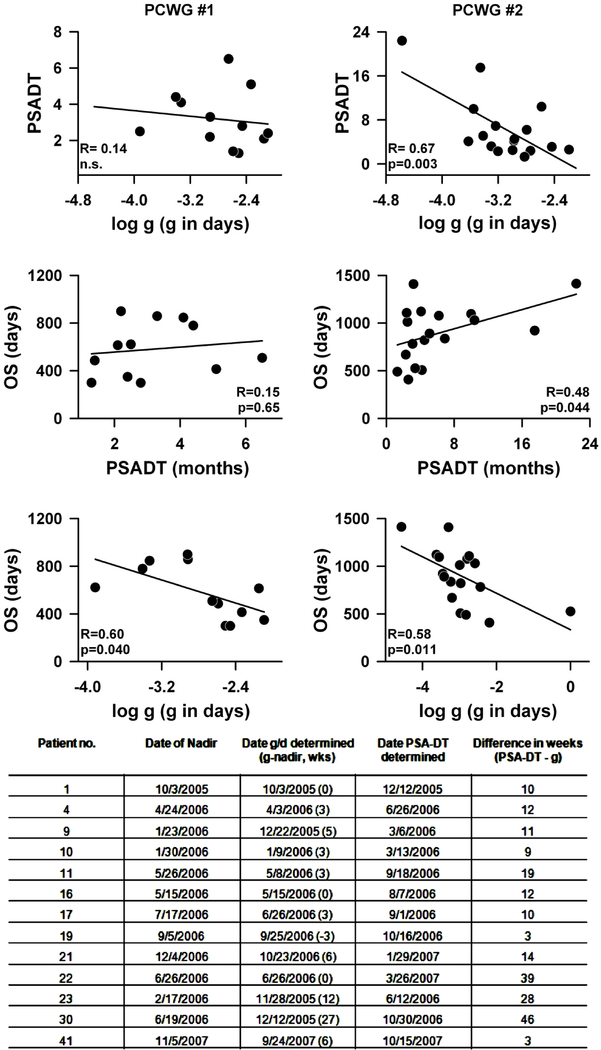
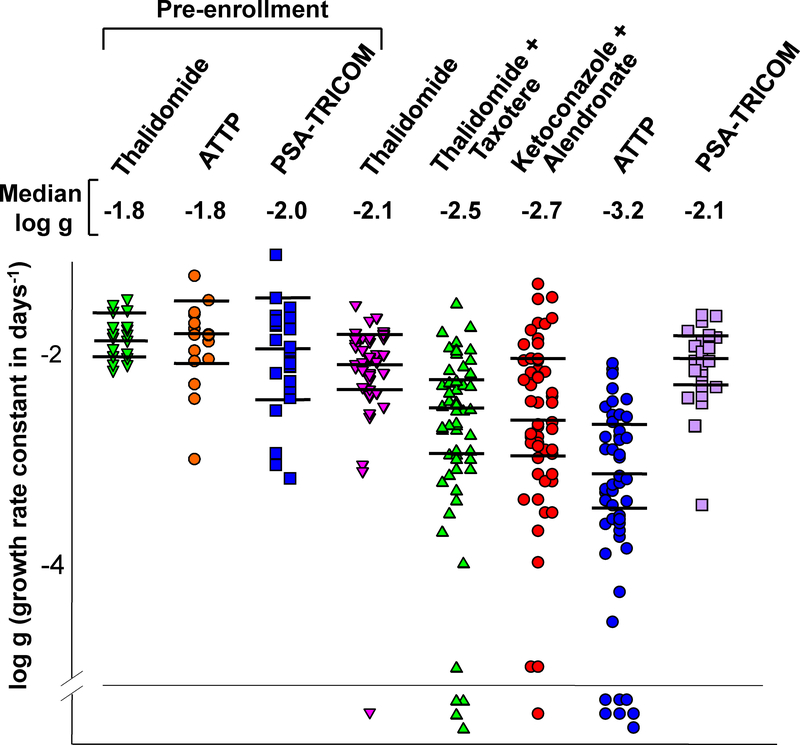
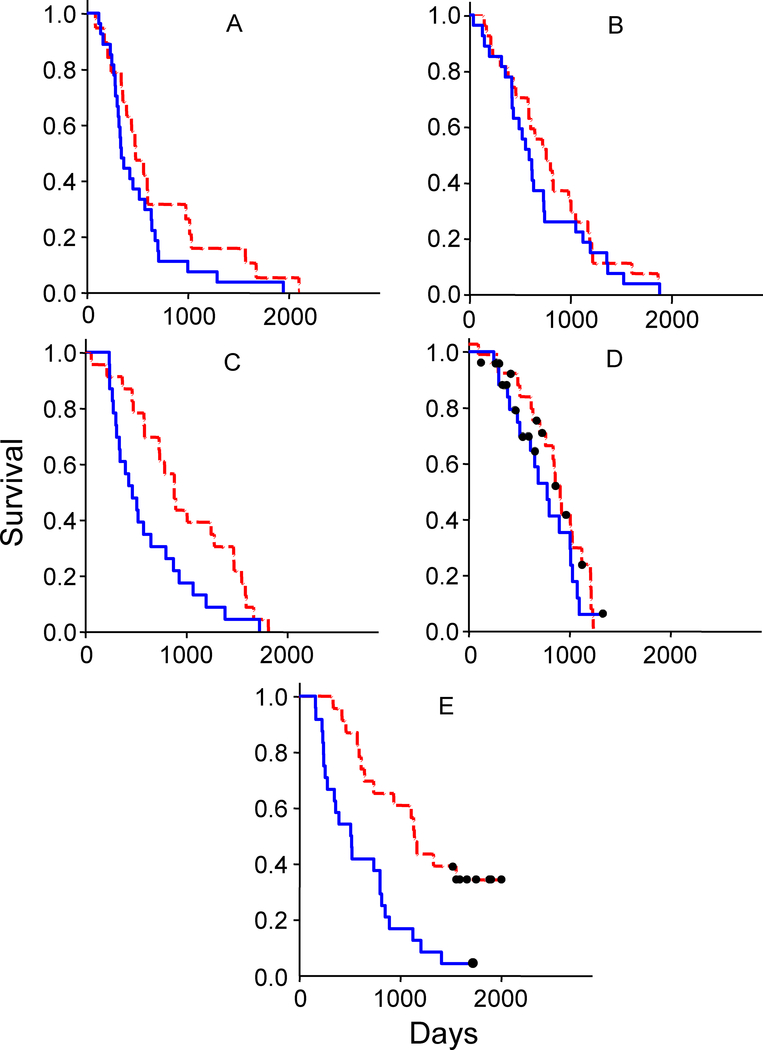
Results: Growth rate constants (g) can be estimated while patients receive therapy and in such patients g is superior to PSA-DT in predicting OS. Incremental reductions in growth rate constants were recorded in successive trials with a 10-fold slower g in the most recent combination therapy trial (log g = 10(-3.17)) relative to single-agent thalidomide (log g = 10(-2.08)) more than a decade earlier. Growth rate constants correlated with survival, except in patients receiving vaccine-based therapy where the evidence demonstrates prolonged survival presumably due to immunity developing subsequent to vaccine administration.

Conclusion: Incremental reductions in tumor growth rate constants suggest increased efficacy in successive chemotherapy trials. The derived growth rate constant correlates with survival, and may be used to assess efficacy. The PSA-TRICOM vaccine appears to have provided marked benefit not apparent during vaccination, but consistent with subsequent development of a beneficial immune response. If validated as a surrogate for survival, growth rate constants would offer an important new efficacy endpoint for clinical trials.


Figures

Figure 1:
Figure 1:
Dependence of patient survival (Y axis in days) on the log of the growth rate constants. All X-axes are logarithmic scales. Growth rate constants (g, per day) were derived using Eq. (1) or Eq. (3). (A) thalidomide (R = 0.38, p = 0.027); (B) ketoconazole plus alendronate (R = 0.69, p < 0.0001); (C) thalidomide plus docetaxel (R = 0.74, p < 0.0001); (D) ATTP (R = 0.42, p = 0.005); and (E) PSA-TRICOM (R = 0.25, p = 0.13) studies, respectively. The encircled points signify patients still alive at close of follow-up.
Figure 2:
Figure 2:
Comparison of PSA-DT and g were made using two data sets: PCWG #1 = data gathered early in the study when the guidelines of the Prostate-Specific Antigen Working Group [22] were followed in making clinical decisions. Progression scored if two consecutively rising PSA levels were obtained. PSA-DT estimated from the nadir to the progression end-point. PCWG #2 = data obtained in the latter part of the study when the guidelines of the Prostate Cancer Clinical Trials Working Group 2 [23] were used to make clinical decisions. Treatment continued until radiographic or symptomatic progression was seen, or as long as treatment was tolerated. PSA-DT estimated from the point of progressive disease to the time treatment was terminated. For each of the datasets, the top panels compare PSA-DT versus log g, the middle panels show the regression of OS against PSA-DT while the lower panels depict the correlation of log g with OS. Values of PSA-DT estimated using the data set from the latter part of the study correlate well with log g values and OS. The table at the bottom of the figure compares thirteen randomly chosen data sets from the ATTP study. The table summarizes when in the clinical course a reliable g or PSA-DT value comparable to that obtained with the complete data set and able to predict OS could be determined. A value for g comparable to that obtained with the entire data set could be estimated a median of 12 weeks earlier than a PSA-DT (number in parentheses is how many weeks before the nadir). The PSA-DT was calculated using the Memorial Sloan Kettering Cancer Center online tool [http://www.mskcc.org/applications/nomograms/prostate/PsaDoublingTime.aspx].
Figure 3:
Figure 3:
Dot plots of the distribution of the best-fit growth rate constants in studies conducted over time. The horizontal lines in each set are the median values and the 95% confidence intervals. The Y-axis is the logarithm of the derived growth rate constant. The regression rate constants for patients prior to enrollment on a study are also shown for the thalidomide, ATTP, and PSA-TRICOM trials. Median g values for each study are listed above the dot plots. Symbols below the horizontal line represent patients who achieved a complete response (CR).
Figure 4:
Figure 4:
Kaplan Meier survival analyses. In each study, cases were stratified by initial PSA signal and divided into below (dashed red lines) and above (solid blue lines) the median signal for that study. Panels (A) through (E) depict data from: (A) thalidomide, (B) ketoconazole plus alendronate, (C) thalidomide plus docetaxel, (D) ATTP and (E) PSA-TRICOM clinical trials, respectively. In (F), data for all five studies are combined, but here the data sets were further stratified into those below and above the median g (growth rate) for that set, and the data for those with low initial PSA, and also low g depicted. The survival curves are color-coded: thalidomide (red), ketoconazole alendronate (black), thalidomide docetaxel (blue), ATTP (light green), and PSA-TRICOM (dark green). In panels D, E and F, patients still alive are depicted by black dots.
Figure 5:
Figure 5:
Projected PSA curves computed using derived median g and d rate constants, substituted into Eq. (1). Panels (A) through (D) depict predictions derived from (A) ketoconazole plus alendronate; (B) thalidomide plus docetaxel; (C) ATTP, and (D) PSA-TRICOM studies, respectively. In each plot, the leftmost black solid lines are the projected PSA curves based on the mean of the pre-treatment g values from the thalidomide, ATTP and PSA-TRICOM studies; while the red curve is the projected PSA curve using, in each study, the appropriate g and d values calculated using PSA values obtained while patients were on study. The dashed vertical black line in each panel denotes the median OS of that study. To have the predicted PSA curve for the three chemotherapy trials (A, B and C) intersect the horizontal line (at a relative PSA signal of 44) at the actual median OS requires fitting the curve to a model (dotted blue curve) in which the growth rate, g, reverts to a higher rate when study therapy ceases (depicted by the black arrow) and continues until death at a relative PSA signal of 44. These rates are in A, B, and C, 4.2-fold, 3.0-fold, and 20.6-fold higher than the respective on-study rate in each case, and very similar to the pre-treatment rates shown as the solid black curves. In the PSA-TRICOM study (D) the blue curve, that intersects the horizontal line at the OS, is modeled with a projected slower growth rate after treatment that is 0.50 fold the on-study rate.

References

    1. American Cancer Society. Cancer Facts & Figures 2009. Atlanta: American Cancer Society; 2009. http://www.cancer.org/docroot/STT/stt_0.asp
    1. Petrylak D Therapeutic options in androgen-independent prostate cancer: building on docetaxel. BJU Int. 2005; 96 Suppl 2:41–6. - PubMed
    1. Sharifi N, Gulley JL, Dahut WL. Androgen deprivation therapy for prostate cancer. JAMA. 2005; 294:238–44. - PubMed
    1. Stein WD, Yang J, Bates SE, Fojo T. Bevacizumab reduces the growth rate constants of renal carcinomas: a novel algorithm suggests early discontinuation of bevacizumab resulted in a lack of survival advantage. Oncologist. 2008; 13: 1055–62. - PMC - PubMed
    1. Stein WD, Figg WD, Dahut W, Stein AD, Hoshen MB, Price D, Bates SE, Fojo T. Tumor growth rates derived from data for patients in a clinical trial correlate strongly with patient survival: a novel strategy for evaluation of clinical trial data. Oncologist. 2008; 13: 1046–54. - PMC - PubMed

MeSH terms

Substances