. 2010 Dec 14;107(50):21860-5.
doi: 10.1073/pnas.1015751107. Epub 2010 Nov 24.

Shear stress-induced changes of membrane transporter localization and expression in mouse proximal tubule cells

Affiliations

Shear stress-induced changes of membrane transporter localization and expression in mouse proximal tubule cells

Yi Duan et al. Proc Natl Acad Sci U S A. .

Abstract

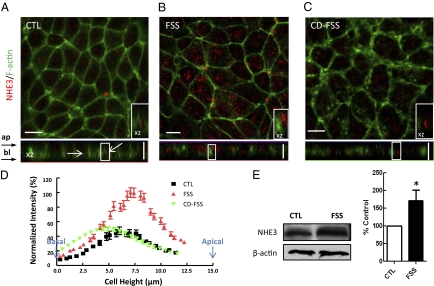
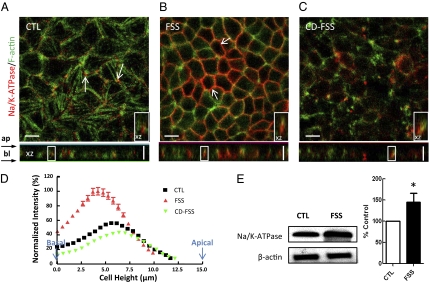
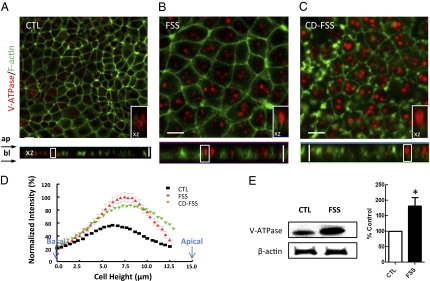
Our previous studies of microperfused single proximal tubule showed that flow-dependent Na(+) and HCO(3)(-) reabsorption is due to a modulation of both NHE3 and vacuolar H(+)-ATPase (V-ATPase) activity. An intact actin cytoskeleton was indicated to provide a structural framework for proximal tubule cells to transmit mechanical forces and subsequently modulate cellular functions. In this study, we have used mouse proximal tubule (MPT) cells as a model to study the role of fluid shear stress (FSS) on apical NHE3 and V-ATPase and basolateral Na/K-ATPase trafficking and expression. Our hypothesis is that FSS stimulates both apical and basolateral transporter expression and trafficking, which subsequently mediates salt and volume reabsorption. We exposed MPT cells to 0.2 dynes/cm(2) FSS for 3 h and performed confocal microscopy and Western blot analysis to compare the localization and expression of both apical and basolateral transporters in control cells and cells subjected to FSS. Our findings show that FSS leads to an increment in the amount of protein expression, and a translocation of apical NHE3 and V-ATPase from the intracellular compartment to the apical plasma membrane and Na/K-ATPase to the basolateral membrane. Disrupting actin by cytochalasin D blocks the FSS-induced changes in NHE3 and Na/K-ATPase, but not V-ATPase. In contrast, FSS-induced V-ATPase redistribution and expression are largely inhibited by colchicine, an agent that blocks microtubule polymerization. Our findings suggest that the actin cytoskeleton plays an important role in FSS-induced NHE3 and Na/K-ATPase trafficking, and an intact microtubule network is critical in FSS-induced modulation of V-ATPase in proximal tubule cells.


Conflict of interest statement

The authors declare no conflict of interest.

Figures

Fig. 1.
Fig. 1.
Effect of FSS on NHE3 trafficking and expression in confluent MPT cells. Immunofluorescence images of MPT cells under control (CTL) (A), FSS (B), and cytochalasin D (CD-FSS) conditions (C). The antibody stained for NHE3 (red) and actin filaments (green), respectively. In control, NHE3 scattered in the cytoplasm and mainly localized below the actin rings (arrows). After 3-h FSS at 0.2 dynes/cm2, the NHE3 staining was stronger and the stained areas were larger than those in control cells. (Inset) Majority of NHE3 now localize at the apical region. (D) Distributions of normalized NHE3-stained fluorescence intensity. The values were normalized such that the mean maximum value in the stimulation group was 100% in each experiment. The fluorescence intensity of the cells was shifted to the right (cell apex) after application of FSS (red). This effect was blunted with the addition of CD (green). (E) Western blot analysis showing NHE3 levels under control and FSS conditions. Expression levels of NHE3 were normalized on actin expression in the same lane. Results in bar graph are means ± SE and are percentage of control condition (*P < 0.05). Clearly, FSS induced NHE3 upregulation. (Inset) Magnified view of the boxed region on XZ images (10 × 5 μm). (Scale bars, 10 μm.)
Fig. 2.
Fig. 2.
Effect of FSS (3 h at 0.2 dynes/cm2) on Na/K-ATPase trafficking and expression in MPT cells. Immunofluorescence images of MPT cells under control (CTL) (A), FSS (B), and cytochalasin D (CD-FSS) conditions (C). The antibody stained for Na/K-ATPase (red) and actin filaments (green), respectively. In CTL, Na/K-ATPase weakly distributed mainly at the basolateral membrane with some intensive staining near the cell-cell contacts (arrows). After FSS, an elevation in membrane Na/K-ATPase expression was observed mainly at the cell periphery (arrows). Colocalization of Na/K-ATPase and actin was prominent (XZ image, Inset). CD significantly blunted the flow-dependent effects. (D) Distributions of normalized Na/K-ATPase-stained fluorescence intensity. The fluorescence intensity of the cells was shifted to the left (cell base) after application of FSS (red line). This effect was blunted with the addition of CD (green line). (E) Na/K-ATPase and actin control were detected by Western blot. Results in bar graph are means ± SE and are percentage of control condition (*P < 0.05). (Inset) Magnified view of the boxed region on XZ images (10 × 5 μm). (Scale bars, 10 μm.)
Fig. 3.
Fig. 3.
Effect of FSS (3 h at 0.2 dynes/cm2) on V-ATPase trafficking and expression in MPT cells. Immunofluorescence images of MPT cells under control (CTL) (A), FSS (B), and cytochalasin D (CD-FSS) conditions (C). The antibody stained for V-ATPase (red) and actin filaments (green), respectively. In CTL, only 20% of the cells express V-ATPase. After FSS stimulation, V-ATPase was expressed more evenly and brightly in every cell. There is a translocation of V-ATPase witnessed in the XZ image. CD did not affect the flow-dependent up-regulation and translocation of V-ATPase. (D) Distributions of normalized V-ATPase-stained fluorescence intensity. The fluorescence intensity of the cells was shifted to the right (cell apex) after application of FSS (red). (E) V-ATPase and actin control were detected by Western blot. Results in bar graph are means ± SE and are percentage of control condition (*P < 0.05). (Inset) Magnified view of the boxed region on XZ images (10 × 5 μm). (Scale bars, 10 μm.)

References

    1. Schnermann J, Wahl M, Liebau G, Fischbach H. Balance between tubular flow rate and net fluid reabsorption in the proximal convolution of the rat kidney. I. Dependency of reabsorptive net fluid flux upon proximal tubular surface area at spontaneous variations of filtration rate. Pflugers Arch. 1968;304:90–103. - PubMed
    1. Giebisch G, Windhager EE. Characterization of renal tubular transport of sodium chloride and water as studied in single nephrons. Am J Med. 1963;34:1–6. - PubMed
    1. Du Z, et al. Axial flow modulates proximal tubule NHE3 and H-ATPase activities by changing microvillus bending moments. Am J Physiol Renal Physiol. 2006;290:F289–F296. - PubMed
    1. Malnic G, Berliner RW, Giebisch G. Flow dependence of K+ secretion in cortical distal tubules of the rat. Am J Physiol. 1989;256:F932–F941. - PubMed
    1. Satlin LM, Sheng S, Woda CB, Kleyman TR. Epithelial Na(+) channels are regulated by flow. Am J Physiol Renal Physiol. 2001;280:F1010–F1018. - PubMed

Publication types

MeSH terms

LinkOut - more resources