Comparative Study
. 2010 Nov 24;30(47):15778-89.
doi: 10.1523/JNEUROSCI.3163-10.2010.

Neural representations of relevant and irrelevant features in perceptual decision making

Affiliations
Comparative Study

Neural representations of relevant and irrelevant features in perceptual decision making

Andrew S Kayser et al. J Neurosci. .

Abstract

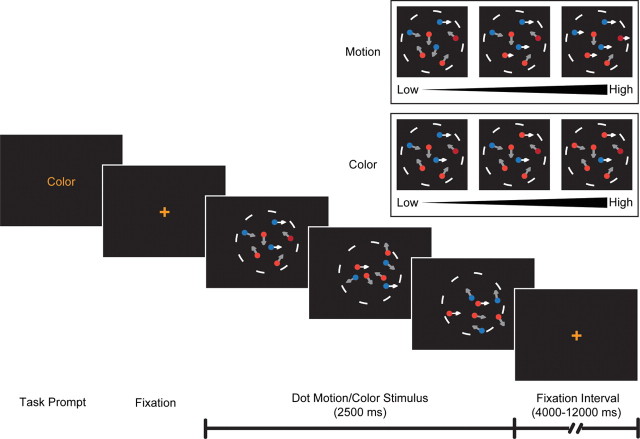
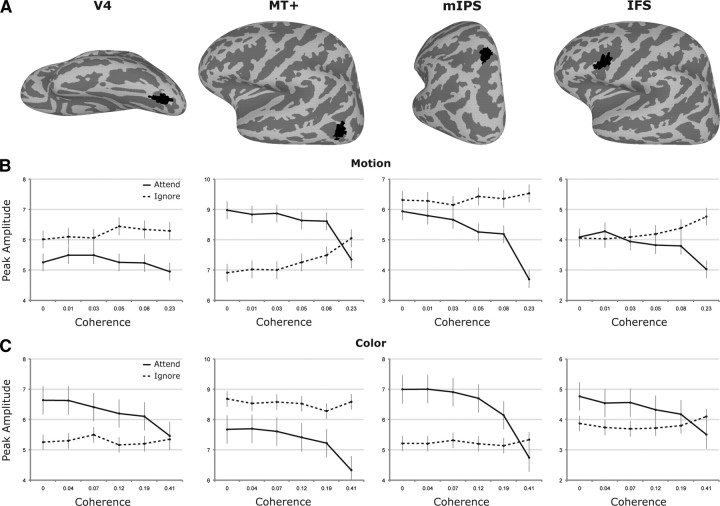
Although perceptual decision making activates a network of brain areas involved in sensory, integrative, and motor functions, circuit activity can clearly be modulated by factors beyond the stimulus. Of particular interest is to understand how the network is modulated by top-down factors such as attention. Here, we demonstrate in a motion coherence task that selective attention produces marked changes in the blood oxygen level-dependent (BOLD) response in a subset of regions within a human perceptual decision-making circuit. Specifically, when motion is attended, the BOLD response decreases with increasing motion coherence in many regions, including the motion-sensitive area MT+, the intraparietal sulcus, and the inferior frontal sulcus. However, when motion is ignored, the negative parametric response in a subset of this circuit becomes positive. Through both modeling and connectivity analyses, we demonstrate that this inversion both reflects a top-down influence and segregates attentional from accumulation regions, thereby permitting us to further delineate the contributions of different regions to the perceptual decision.


Figures

Figure 1.
Figure 1.
Motion/color discrimination task. Each run began with a distinctly colored text prompt defining the attended feature (motion or color) for the upcoming trials. To assist subjects in maintaining task set, the fixation cross was then rendered in the same color as the text prompt for the duration of the run. Subjects were cued to the upcoming stimulus by the dimming of the cross to a low-contrast gray, at which point the dot stimulus appeared within a central circular aperture of 7.5° diameter (dashed circle) for 2500 ms. For each trial, independent values for motion coherence and color proportion were chosen; across trials, these values varied in discrete steps from low to high (inset), in subject-specific fashion, to match predefined levels of accuracy from 50 to 100%.
Figure 2.
Figure 2.
A, Coherence calibration. Based on performance during training on predetermined coherence values (orange points), diffusion model fits were generated for each subject with respect to each feature (motion or color; sample gray curve shown for a hypothetical motion coherence calibration). Calibrated coherence values predicted to generate 50, 60, … 100% performance were extrapolated from these models (green points). B, Subject behavioral performance. Mean accuracy and reaction time values for motion (top) and color (bottom) tasks for each subject are shown across the calibrated coherence values. Each of the five subjects is represented by a different grayscale color; each coherence level is represented by the geometric mean of the actual coherence values across subjects. For accuracy, asterisks denote significant deviation from expected accuracy (p < 0.05). For reaction times, error bars represent SDs.
Figure 3.
Figure 3.
Whole-brain parametric fixed-effects contrasts across the four attend/ignore motion/color conditions. All contrasts are shown at p < 0.005, uncorrected, for display purposes, after being defined at p < 0.001, uncorrected, with an additional overlap requirement (see Materials and Methods). A, Motion, both attended (top) and ignored (bottom). The blue color scale denotes negative parametric variation of the BOLD response with motion coherence level; the red-yellow color scale denotes positive parametric variation. As evident in the figure, a subset of brain regions that demonstrated a negative parametric variation with motion coherence in the attend-motion condition also demonstrated a positive parametric variation with motion coherence in the ignore-motion condition. (Note that the attend-motion and ignore-color conditions, as well as attend-color and ignore-motion conditions below, represent the same trials with a different parameterization.) The inset slice is taken from z = −4 (MNI space). B, Color, both attended (top) and ignored (bottom). As for motion, the blue color scale denotes negative parametric variation with coherence level (in this case, for color), whereas a yellow color scale denotes positive parametric variation. A similar network is seen in the attend-color condition as was seen in the attend-motion condition, although with pronounced activity in V4. For the ignore-color condition, however, no significant correlations with ignored color coherence were found. The inset slice is taken from z = −21 (MNI space). See also supplemental Figure S1 (available at www.jneurosci.org as supplemental material).
Figure 4.
Figure 4.
Peak amplitudes derived from time course data for selected ROIs. A, Surface maps illustrating the anatomical locations of ROIs V4, MT+, mIPS, and IFS. B, Peak amplitudes for each of the four ROIs ± 95% confidence intervals for the attend-motion (solid lines) and ignore-motion (dashed lines) conditions. Negative parametric trends are significant (p < 0.05) in the attended condition for MT+, mIPS, and IFS; positive parametric trends in the ignored condition are significant for MT+ and IFS only. C, Peak amplitudes for each of the four ROIs ± 95% confidence intervals for the attend-color (solid lines) and ignore-color (dashed lines) conditions. Negative parametric trends are significant (p < 0.05) for MT+ and mIPS, reaching trend significance for V4 (p = 0.085) and IFS (p = 0.063) for the attended condition. No parametric trends are significant for the ignored condition.
Figure 5.
Figure 5.
Model of MT+ activity across attend and ignore conditions. A, Bottom-up inputs (black) are assumed to be present for the duration of the stimulus, but modulated in multiplicative fashion by top-down inputs (white) for the duration of the reaction time. In the attend-motion condition, high motion coherence is typically associated with shorter reaction times, whereas low motion coherence is associated with longer reaction times, represented by the width of the white bars. In the ignore-motion condition, reaction time is determined by the independently varying color proportion, represented by the variable-length white bars. B, Fits of the model (solid lines) to the actual peak amplitudes (filled circles) for the attend- and ignore-motion conditions across all five subjects (grayscale lines). C, Predicted values for the top-down multiplier in the attend-motion and ignore-motion conditions, across the five subjects ± SEM. *p < 0.05. D, Predicted values for the bottom-up input across both attend-motion and ignore-motion conditions ± 95% confidence intervals.
Figure 6.
Figure 6.
Granger analysis results. BOLD activity within selected ROIs (V4, MT+, mIPS, IFS) was examined for Granger causal influences. A, The arrows indicate direction of influence for all significant connections. B, When conditioned on IFS, the Granger causal influences between mIPS, MT+, and V4 remained. C, When conditioned on mIPS, no Granger causal influences reached significance. These findings argue that mIPS exhibits a top-down influence on MT+ and V4 independently of IFS, and that the magnitude of the influence of IFS on these posterior regions may be at least partially mediated via mIPS.

Similar articles

Cited by

References

    1. Amano K, Wandell BA, Dumoulin SO. Visual field maps, population receptive field sizes, and visual field coverage in the human MT+ complex. J Neurophysiol. 2009;102:2704–2718. - PMC - PubMed
    1. Aron AR, Robbins TW, Poldrack RA. Inhibition the right inferior frontal cortex. Trends Cogn Sci. 2004;8:170–177. - PubMed
    1. Beck DM, Kastner S. Top-down and bottom-up mechanisms in biasing competition in the human brain. Vision Res. 2009;49:1154–1165. - PMC - PubMed
    1. Binder JR, Liebenthal E, Possing ET, Medler DA, Ward BD. Neural correlates of sensory and decision processes in auditory object identification. Nat Neurosci. 2004;7:295–301. - PubMed
    1. Brainard DH. The Psychophysics Toolbox. Spat Vis. 1997;10:433–436. - PubMed

Publication types

LinkOut - more resources