Comparative Study
. 2010 Nov 24;30(47):15866-77.
doi: 10.1523/JNEUROSCI.2891-10.2010.

Calcium regulates vesicle replenishment at the cone ribbon synapse

Affiliations
Comparative Study

Calcium regulates vesicle replenishment at the cone ribbon synapse

Norbert Babai et al. J Neurosci. .

Abstract

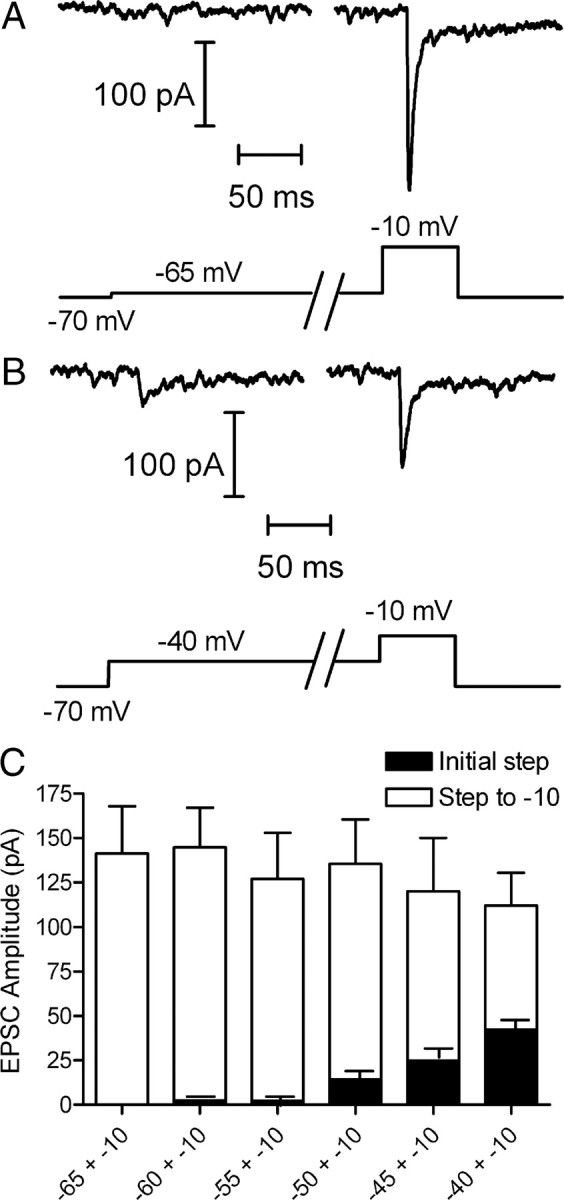
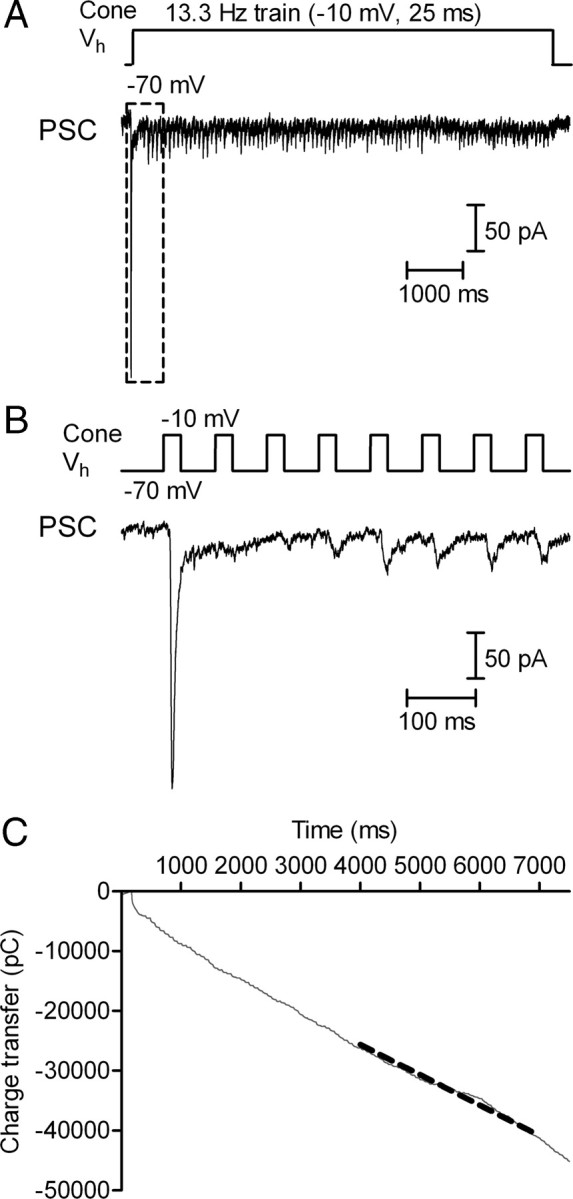
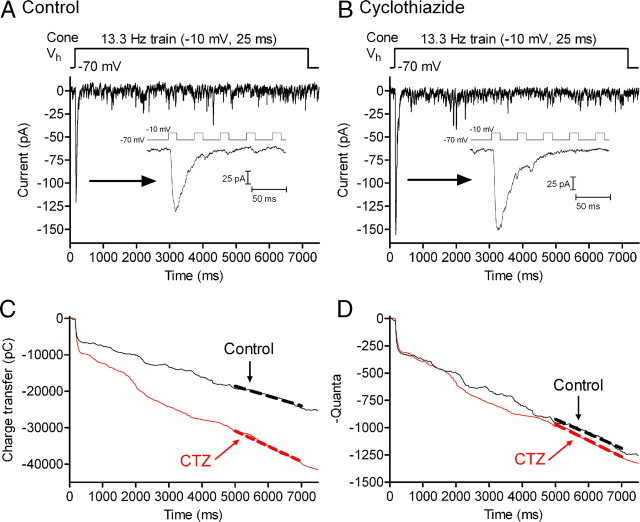
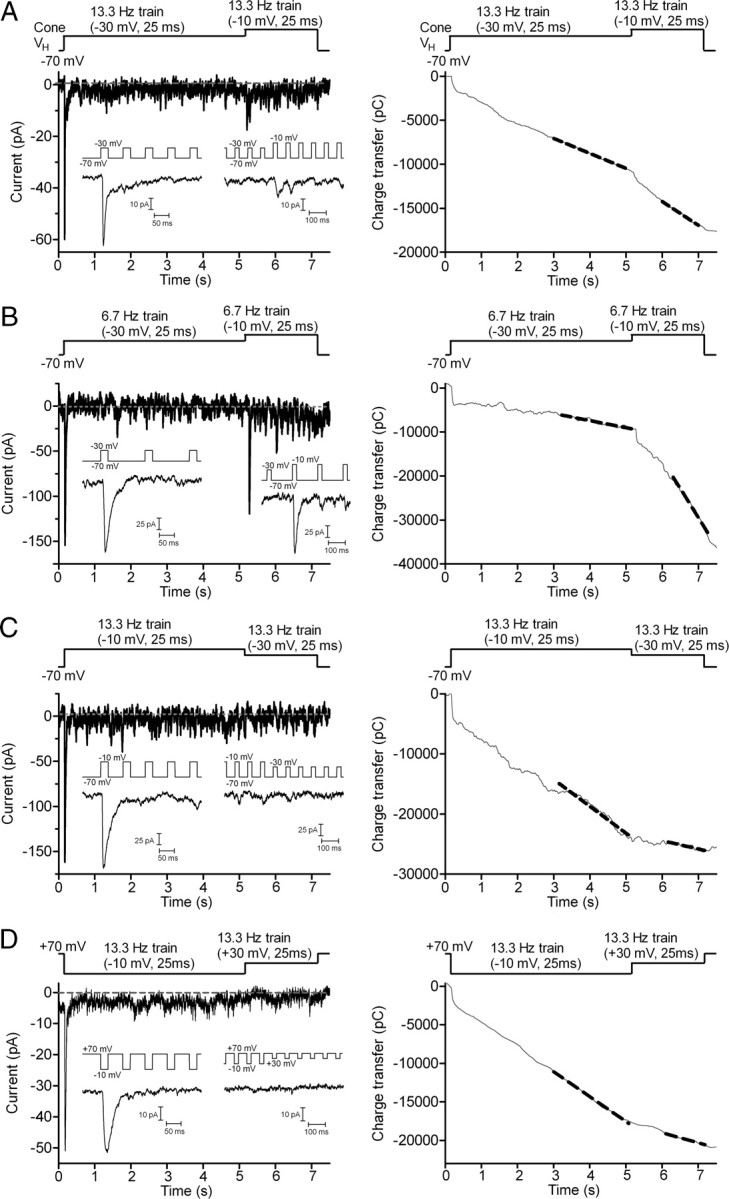
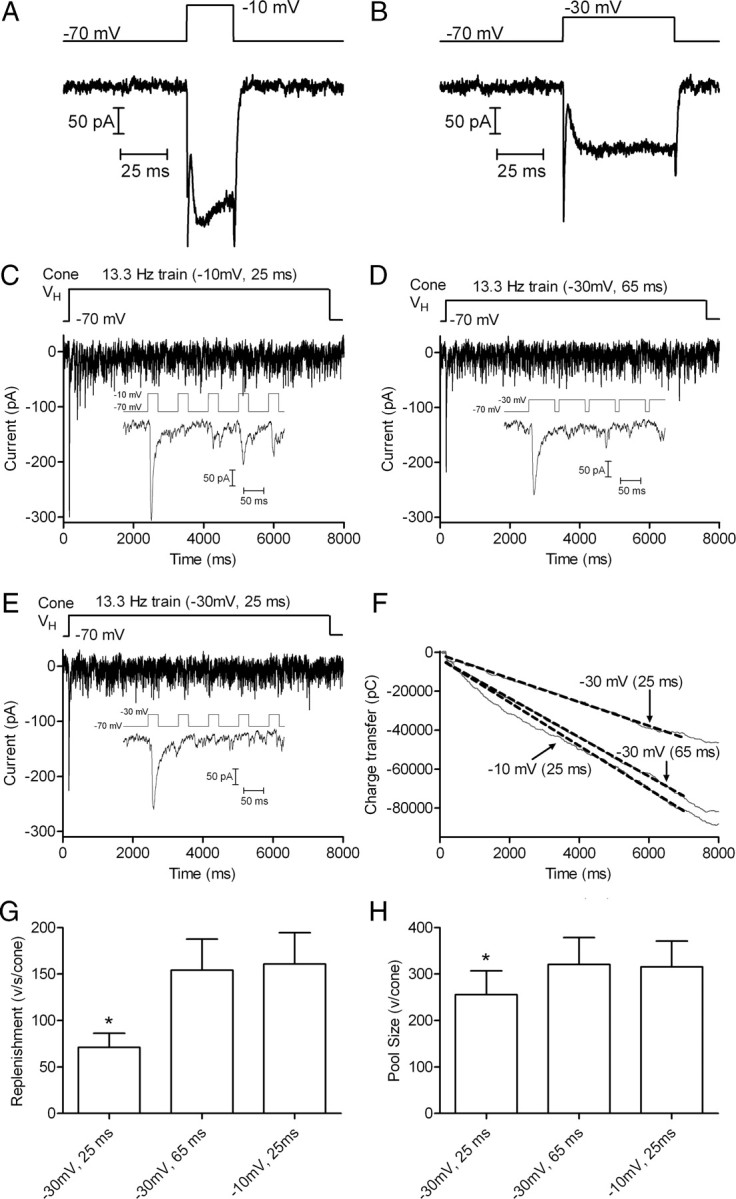
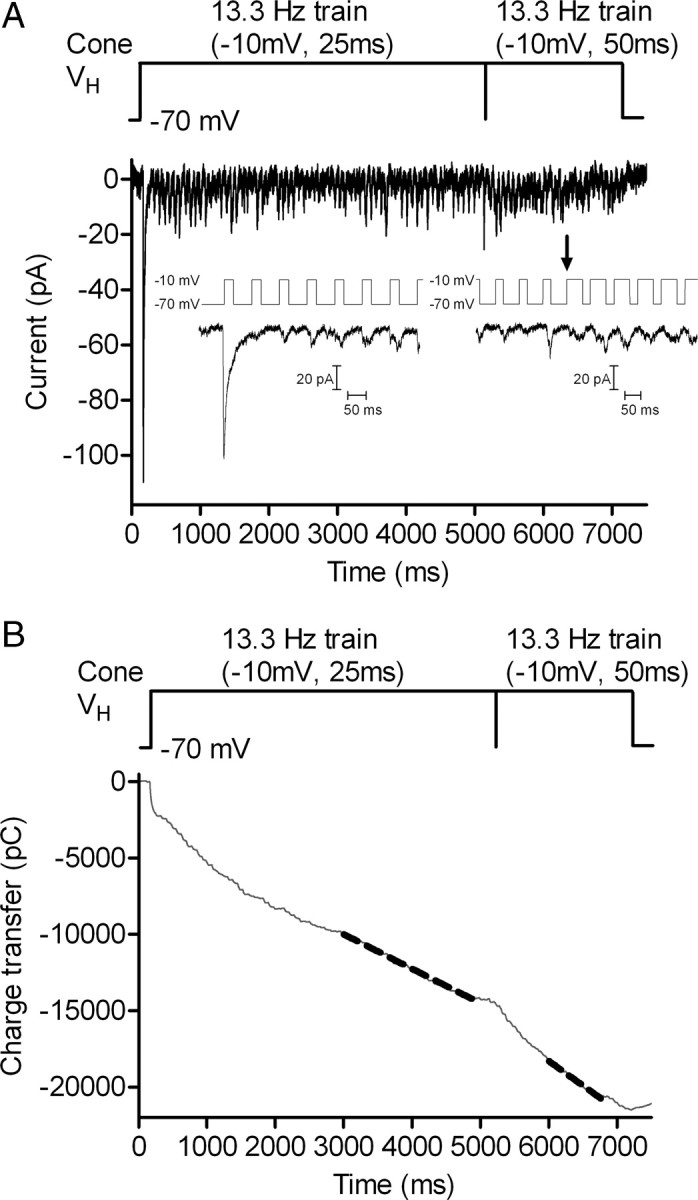
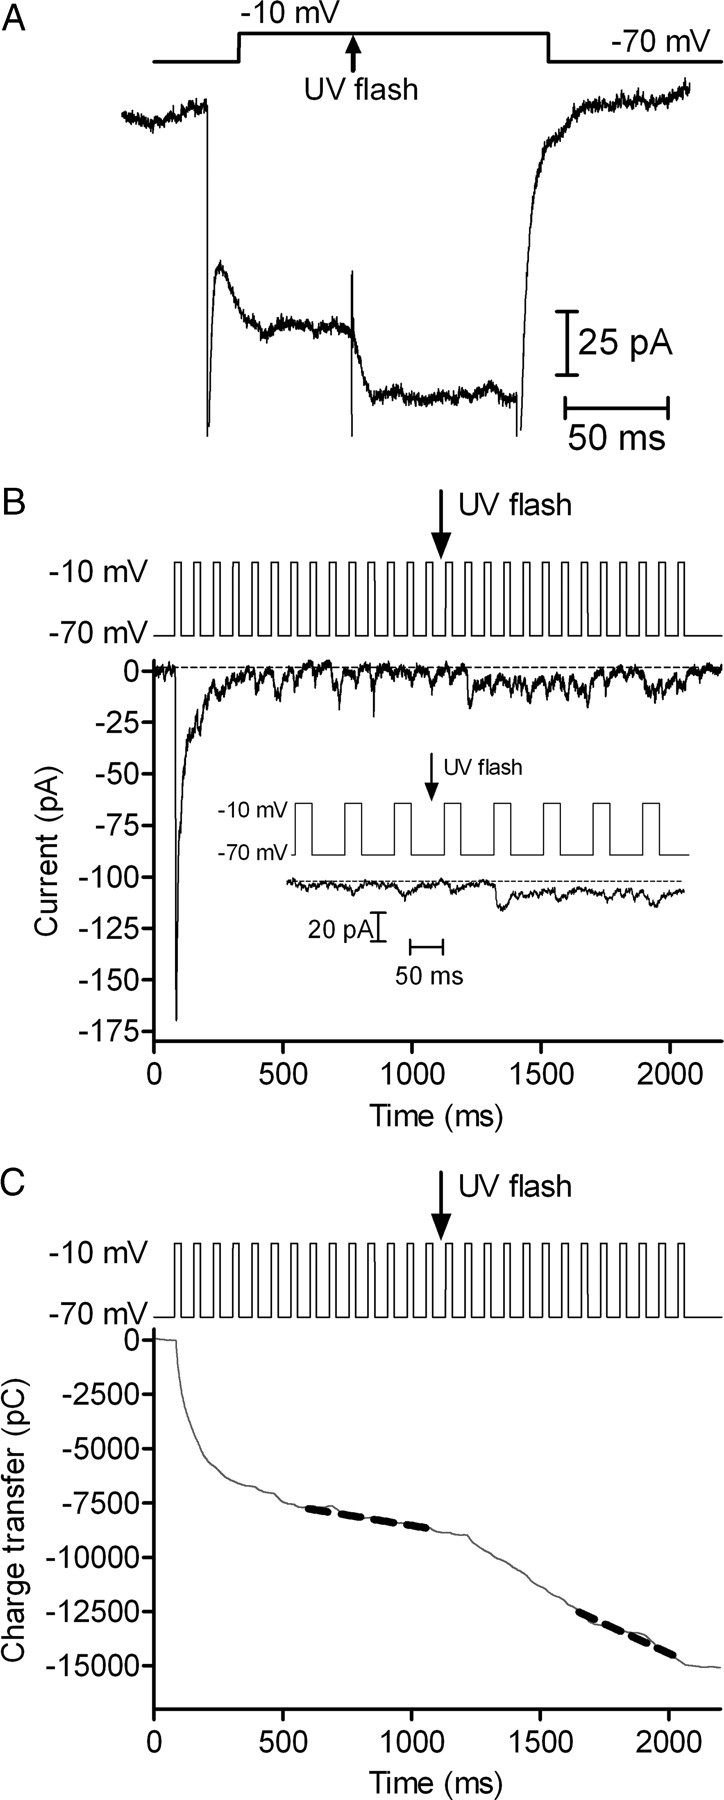
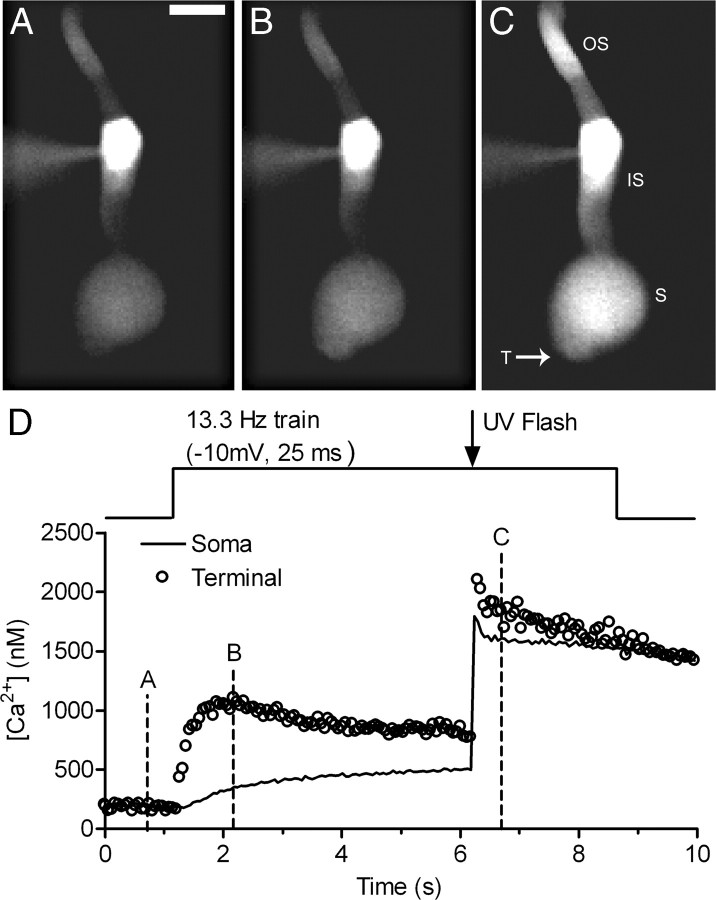
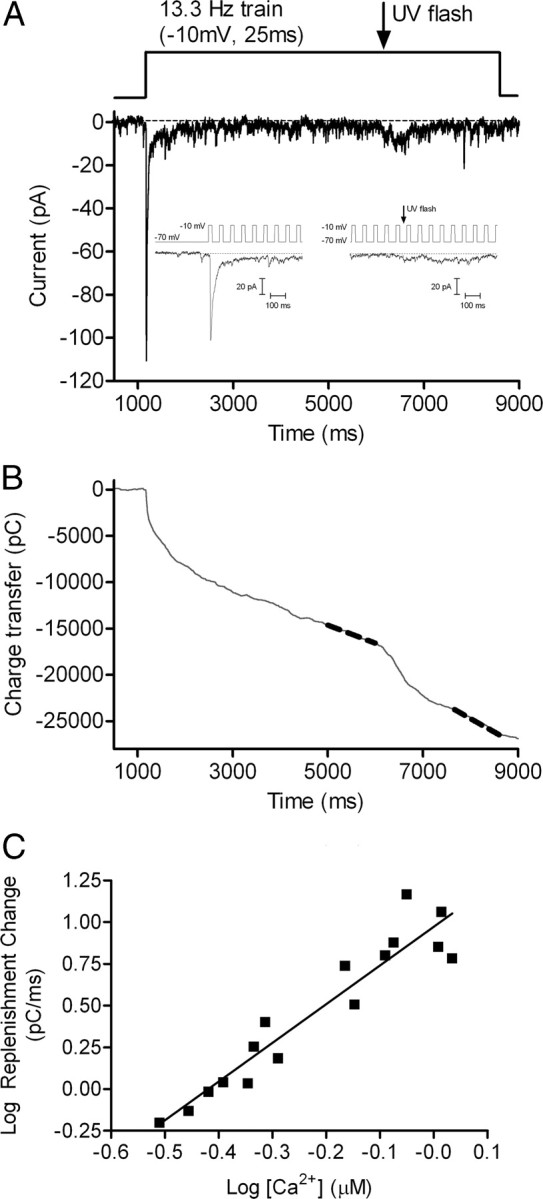
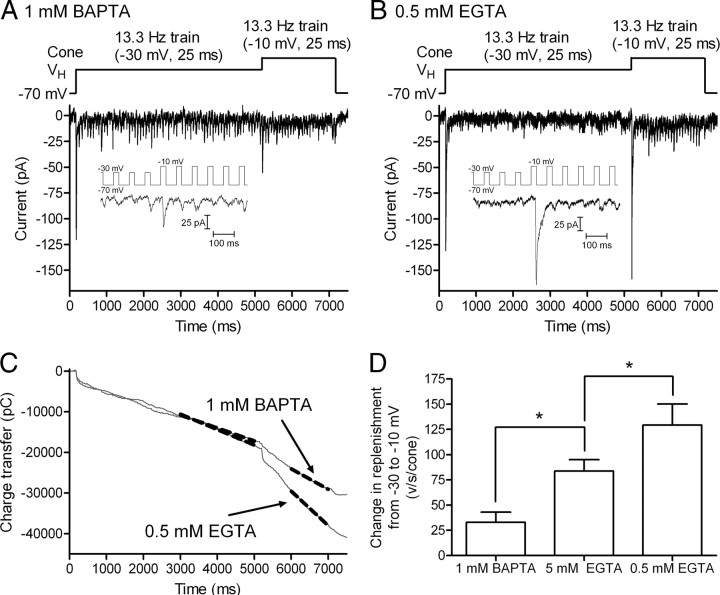
Cones release glutamate-filled vesicles continuously in darkness, and changing illumination modulates this release. Because sustained release in darkness is governed by vesicle replenishment rates, we analyzed how cone membrane potential regulates replenishment. Synaptic release from cones was measured by recording postsynaptic currents in Ambystoma tigrinum horizontal or OFF bipolar cells evoked by depolarization of simultaneously voltage-clamped cones. We measured replenishment after attaining a steady state between vesicle release and replenishment using trains of test pulses. Increasing Ca(2+) currents (I(Ca)) by changing the test step from -30 to -10 mV increased replenishment. Lengthening -30 mV test pulses to match the Ca(2+) influx during 25 ms test pulses to -10 mV produced similar replenishment rates. Reducing Ca(2+) driving force by using test steps to +30 mV slowed replenishment. Using UV flashes to reverse inhibition of I(Ca) by nifedipine accelerated replenishment. Increasing [Ca(2+)](i) by flash photolysis of caged Ca(2+) also accelerated replenishment. Replenishment, but not the initial burst of release, was enhanced by using an intracellular Ca(2+) buffer of 0.5 mm EGTA rather than 5 mm EGTA, and diminished by 1 mm BAPTA. This suggests that although release and replenishment exhibited similar Ca(2+) dependencies, release sites are <200 nm from Ca(2+) channels but replenishment sites are >200 nm away. Membrane potential thus regulates replenishment by controlling Ca(2+) influx, principally by effects on replenishment mechanisms but also by altering releasable pool size. This in turn provides a mechanism for converting changes in light intensity into changes in sustained release at the cone ribbon synapse.


Figures

Figure 1.
Figure 1.
Replenishment rates match release rates during sustained depolarization in the physiological voltage range. A, Membrane current recorded from a voltage-clamped horizontal cell while applying a voltage step in the cone to −65 for 8 s. This lengthy test step was followed by a probe step to −10 mV for 100 ms to stimulate release of the remainder of the readily releasable pool. B, EPSC evoked in the same horizontal cell by an initial 8 s step to −40 mV and the subsequent probe step to −10 mV. C, Stacked amplitudes of the initial 8 s test step (black bars, n = 13) and subsequent probe step to −10 mV (white bars). The sum of both responses remained constant over the range of test steps from −65 to −40 mV (ANOVA, p = 0.90), consistent with a balance between replenishment and release. The slight decrease in the summed response is due to response rundown during this extensive series of experiments.
Figure 2.
Figure 2.
Measurement of replenishment rate at the cone synapse using pulse trains. A, A 7 s pulse train (13.3 Hz, 25 ms steps to −10 mV) was applied to the cone while we simultaneously recorded the EPSC from an OFF bipolar cell. Vh, Membrane holding potential. B, Responses to the first 8 test pulses (dashed square in A). C, Cumulative EPSC charge transfer measured by integrating the entire EPSC trace. The replenishment rate was calculated from the linear slope of cumulative charge transfer during the final 2 s of the train. The dashed gray line shows the straight line fit to this region.
Figure 3.
Figure 3.
Cone synapses do not exhibit progressively increasing desensitization. A, EPSC recorded from a voltage-clamped horizontal cell evoked by a pulse train (13.3 Hz, 25 ms steps to −10 mV) applied to a simultaneously voltage-clamped cone. Responses to the first five pulses are magnified in the inset. B, Simultaneous recording from the same cone/horizontal cell pair after application of 100 μm CTZ. Responses to the first five pulses are shown in the inset. C, EPSC charge transfer from the same horizontal cell measured in control conditions (black line) and after application of CTZ (red line). The linear fits to the final 2 s are shown by heavy dashed lines in both conditions. D, EPSC charge transfer in C divided by quantal amplitude in control (20.2 ± 1.03 pC, n = 121 events) and CTZ-treated conditions (31.3 ± 1.56 pC, n = 100). After normalizing for differences in quantal size, the rate of quantal release during the final 2 s of the train did not differ greatly in control (black trace, 133 vesicles/s) and CTZ (red trace, 149 vesicles/s).
Figure 4.
Figure 4.
The rate of replenishment shows a voltage dependence arising from voltage-dependent changes in Ca2+ influx. A, EPSC recorded from a voltage-clamped OFF bipolar cell evoked by a pulse train (13.3 Hz, 25 ms steps from −70 to −30 mV) applied to a simultaneously voltage-clamped cone. After 5 s, the test step amplitude was increased to more strongly activate ICa and thereby increase Ca2+ influx (13.3 Hz, 25 ms steps from −70 to −10 mV). Insets show EPSCs evoked by the first five steps at the beginning of the pulse train and immediately after increasing test step amplitude. Right panel of A, Cumulative charge transfer of the OFF bipolar EPSC shown at the left. Dashed line shows the straight line fits used to determine replenishment rates. The steeper slope indicates that replenishment rate increased after the test step was changed from −30 mV to −10 mV. B, EPSC recorded from a different cone/OFF bipolar cell pair using a longer interpulse interval (150 ms). After applying a 5 s train of pulses to −30 mV (6.7 Hz, 25 ms steps), the test step amplitude was increased to −10 mV. Insets show EPSCs evoked at the beginning of the pulse train and immediately after increasing test step amplitude. Right panel of B, Cumulative charge transfer of the OFF bipolar EPSC shown at the left. C, OFF bipolar cell EPSC evoked by a pulse train beginning with a train of steps to −10 mV (25 ms, 75 ms interpulse intervals, 13.3 Hz) for 5 s followed by a 2 s train of steps to −30 mV. Insets show EPSCs evoked at the beginning of the pulse train and immediately after changing test step amplitude. Right panel of C: Cumulative charge transfer of the OFF bipolar EPSC in C shows a decline in replenishment when the test pulse amplitude was reduced from −10 to −30 mV. The same cell pair was used in B. D, EPSC recorded from another OFF bipolar cell during application of a pulse train (13.3 Hz, 25 ms steps from +70 to −10 mV) to a simultaneously voltage-clamped cone. After 5 s, the test step amplitude was changed to reduce Ca2+ driving force and thereby reduce Ca2+ influx (13.3 Hz, 25 ms steps from +70 to +30 mV). Insets show EPSCs evoked at the beginning of the pulse train and immediately after changing test step amplitude. Right panel of D, Cumulative charge transfer of the OFF bipolar EPSC in C shows a decline in replenishment when the test pulse amplitude was changed to +30 mV.
Figure 5.
Figure 5.
Matching calcium influx during steps to −30 and −10 mV yields matching replenishment rates. A, ICa recorded from a cone in response to a 25 ms step from −70 to −10 mV. Capacitative and leak currents were subtracted using a P/8 protocol. B, ICa recorded from the same cone in response to 65 ms step from −70 to −30 mV. Although the amplitude differed, the charge transfer during ICa was similar with both stimuli: 6338 pC during the 25 ms step to −10 mV and 6692 pC during the 25 ms step to −30 mV. C, EPSCs recorded from an OFF bipolar cell by application of 13.3 Hz train of pulses (−70 to −30 mV, 25 ms) to a presynaptic cone. Inset shows the EPSC evoked by the first five pulses. D, EPSCs evoked in the same OFF bipolar cell by application of a 13.3 Hz train using stronger pulses (−70 to −10 mV, 25 ms) that stimulated greater Ca2+ influx into the presynaptic cone. E, EPSCs evoked in the same OFF bipolar cell using a 13.3 Hz train of pulses to −30 mV that were lengthened to 65 ms to match the Ca2+ influx accompanying 25 ms pulses to −10 mV. F, Plot of cumulative charge transfer during the EPSC for the 3 different pulse trains from the same cell pair. Data points from 5 to 7 s were fit by linear regression to obtain the slope (replenishment rate) and Y-intercept (releasable pool size). G, Comparison of mean replenishment rates obtained with the three different pulse train protocols (n = 10 pairs). H, Comparison of releasable pools measured with the three different pulse train protocols in the same cell pairs.
Figure 6.
Figure 6.
Lengthening a strong depolarizing pulse elevated replenishment rate without expanding the readily releasable pool. A, EPSCs recorded from a horizontal cell in response to a pulse train (13.3 Hz, −70 to −10 mV) applied to a simultaneously voltage-clamped cone. Five seconds into the trial, the pulse duration was lengthened from 25 to 50 ms. Insets show the EPSCs evoked by the first five steps and when the test pulse was lengthened (arrow). Lengthening the test pulse did not evoke an appreciably larger EPSC, consistent with results from Bartoletti et al. (2010) that a 25 ms test pulse to −10 mV empties the readily releasable pool. B, Cumulative release fit with straight lines at the end of each stimulus condition.
Figure 7.
Figure 7.
Abruptly unblocking L-type calcium channels increases replenishment rates. A, Cone ICa recorded in the presence of 3 μm nifedipine and evoked by a step from −70 mV to −10 mV (150 ms). Capacitative and leak currents were subtracted using a P/8 protocol. A brief UV light flash applied in the middle of the step (arrow) abruptly increased ICa by photolytically unblocking the antagonistic effects of nifedipine (Sanguinetti and Kass, 1984). B, EPSCs recorded from an OFF bipolar cell in response to a pulse train (13.3 Hz, −70 to −10 mV) applied to a simultaneously voltage-clamped cone. Recording was obtained in the presence of 3 μm nifedipine. A UV flash was applied in the middle of the pulse train to unblock nifedipine. Inset magnifies a section of the record to show EPSCs shortly before and after the flash. C, Cumulative charge transfer during the EPSC. Dashed gray line shows the straight line fits used to estimate the replenishment rates.
Figure 8.
Figure 8.
An example of calcium uncaging in a cone. A, Single confocal section showing an image of a cone in the retinal slice loaded with DM-nitrophen (10 mm) and the Ca2+ indicator dye OGB-6F (0.5 mm) before stimulation (image was obtained at time point A in the graph). Scale bar is 10 μm. B, Applying a train of pulses (13.3 Hz, −70 mV to −10 mV, 25 ms) increased fluorescence in the terminal and soma regions of the cone (time point B in the graph). C, [Ca2+]i was rapidly elevated in both the soma and terminal by a flash of UV light (time point C in the graph). OS, Outer segment; IS, inner segment; S, soma; T, terminal. D, [Ca2+]i change during the −10 mV train and the UV flash. Open circles show the Ca2+ level of the terminal and solid line shows the [Ca2+]i change measured in the center of the soma.
Figure 9.
Figure 9.
Intracellular calcium dependence of replenishment. A, EPSCs recorded from an OFF bipolar cell in response to a pulse train (13.3 Hz, −70 to −10 mV) applied to a simultaneously voltage-clamped cone. Ca2+ was uncaged from DM-nitrophen by application of a UV light flash 5 s into the trial. Insets magnify EPSCs at the start of the stimulus train and at the time of the UV flash. B, Cumulative charge transfer during the pulse train. Dashed gray line shows the straight line fits used to determine the replenishment rate. C, The relation between the change in replenishment rate observed after Ca2+ uncaging and postflash [Ca2+]i measured near the cone terminal. [Ca2+]i was determined from OGB-6F fluorescence changes using Equation 1. Data were plotted on log/log axes. Solid line shows the straight line fit with a slope of 2.32 ± 0.21.
Figure 10.
Figure 10.
Effects of exogenous calcium buffers on the rate of replenishment in cones. A, EPSC recorded from a voltage-clamped OFF bipolar cell evoked by a pulse train (13.3 Hz, 25 ms steps from −70 to −30 mV) applied to a simultaneously voltage-clamped cone. After 5 s, the test step amplitude was increased to more strongly activate ICa and thereby increase Ca2+ influx (13.3 Hz, 25 ms steps from −70 to −10 mV). The cone patch pipette in this experiment contained 1 mm BAPTA. Experiments shown in previous figures used 5 mm EGTA in the cone patch pipette. B, Same stimulus protocol performed in a different cell pair using 0.5 mm EGTA in the cone pipette solution. Insets in A and B show EPSCs recorded shortly before and after changing the test pulse amplitude from −30 to −10 mV. C, EPSC charge transfer from the two cell pairs shown in A and B. To emphasize the larger slope change observed with 0.5 mm EGTA, we selected cell pairs that exhibited similar rates during the initial train of pulses to −30 mV. Dashed gray lines show straight line fits used to estimate replenishment rates. D, Change in replenishment rate caused by increasing Ca2+ influx with use of a stronger test pulse in the three different buffering conditions: 1 mm BAPTA, 32.9 ± 10.0 v/s/cone (n = 11); 5 mm EGTA, 83.7 ± 11.3 v/s/cone (n = 15); 0.5 mm EGTA, 129.3 ± 20.8 v/s/cone (n = 8); 1 mm BAPTA versus 5 mm EGTA, p = 0.0037; 1 mm BAPTA versus 0.5 mm EGTA, p = 0.0003; 5 mm EGTA versus 0.5 mm EGTA, p = 0.047.

References

    1. Adler EM, Augustine GJ, Duffy SN, Charlton MP. Alien intracellular calcium chelators attenuate neurotransmitter release at the squid giant synapse. J Neurosci. 1991;11:1496–1507. - PMC - PubMed
    1. Babai N, Morgans CW, Thoreson WB. Calcium-induced calcium release contributes to synaptic release from mouse rod photoreceptors. Neuroscience. 2010;165:1447–1456. - PMC - PubMed
    1. Bartoletti TM, Babai N, Thoreson WB. Vesicle pool size at the salamander cone ribbon synapse. J Neurophysiol. 2010;103:419–423. - PMC - PubMed
    1. Cadetti L, Tranchina D, Thoreson WB. A comparison of release kinetics and glutamate receptor properties in shaping rod-cone differences in EPSC kinetics in the salamander retina. J Physiol. 2005;569:773–788. - PMC - PubMed
    1. Cadetti L, Bryson EJ, Ciccone CA, Rabl K, Thoreson WB. Calcium-induced calcium release in rod photoreceptor terminals boosts synaptic transmission during maintained depolarization. Eur J Neurosci. 2006;23:2983–2990. - PMC - PubMed

Publication types