. 2011 Jan 1;186(1):275-83.
doi: 10.4049/jimmunol.1001308. Epub 2010 Nov 24.

Stimulation of the glucocorticoid-induced TNF receptor family-related receptor on CD8 T cells induces protective and high-avidity T cell responses to tumor-specific antigens

Affiliations

Stimulation of the glucocorticoid-induced TNF receptor family-related receptor on CD8 T cells induces protective and high-avidity T cell responses to tumor-specific antigens

Anik L Côté et al. J Immunol. .

Abstract

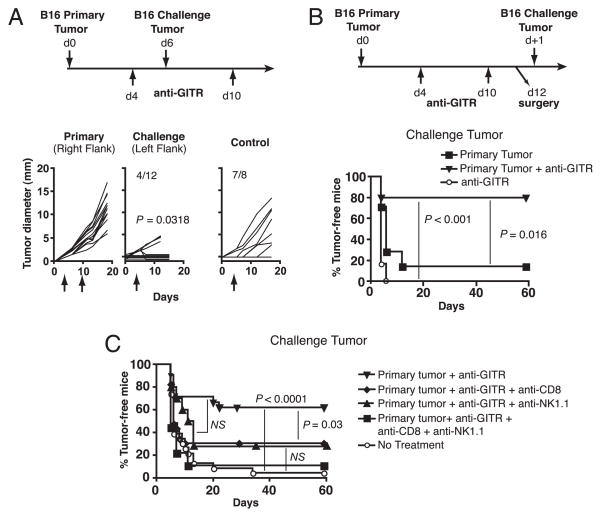
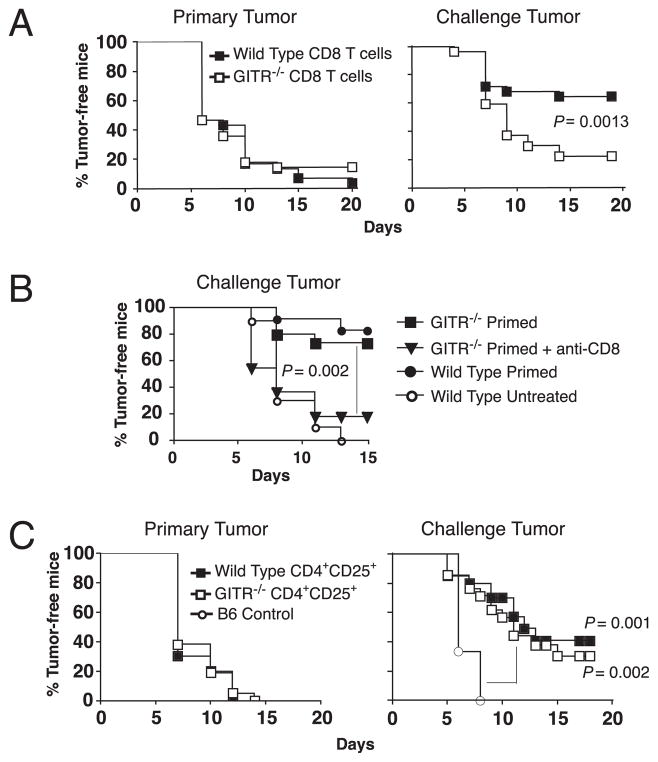
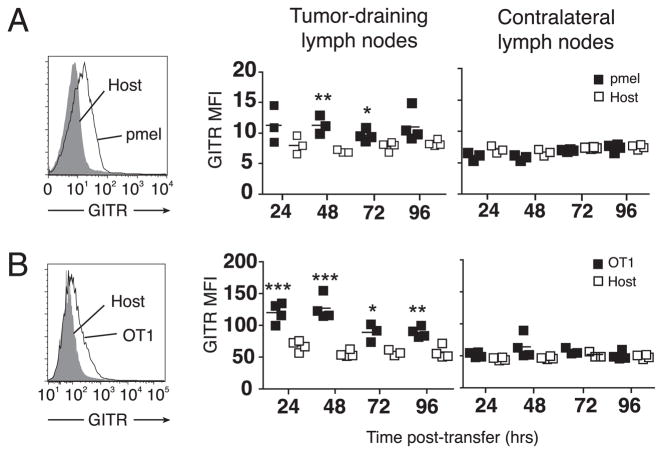
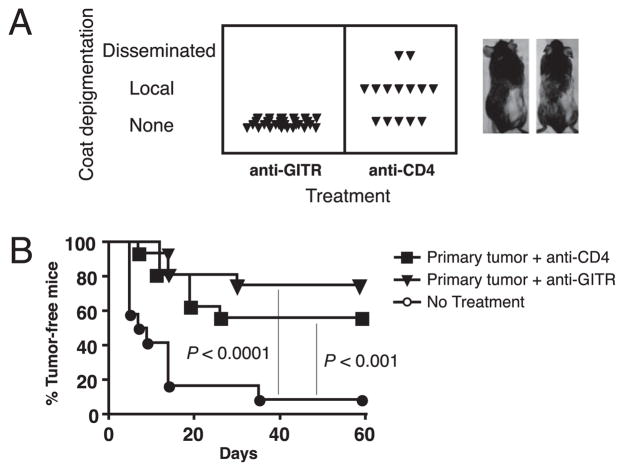
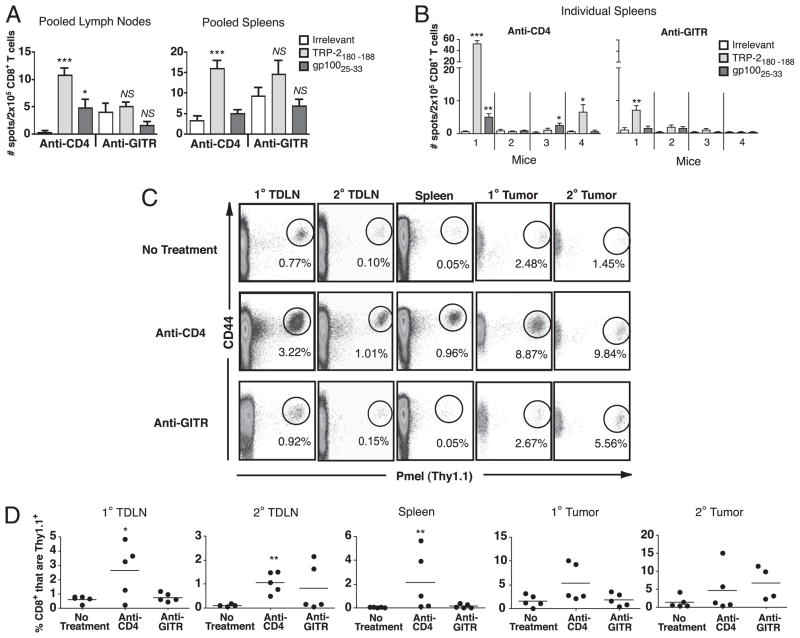
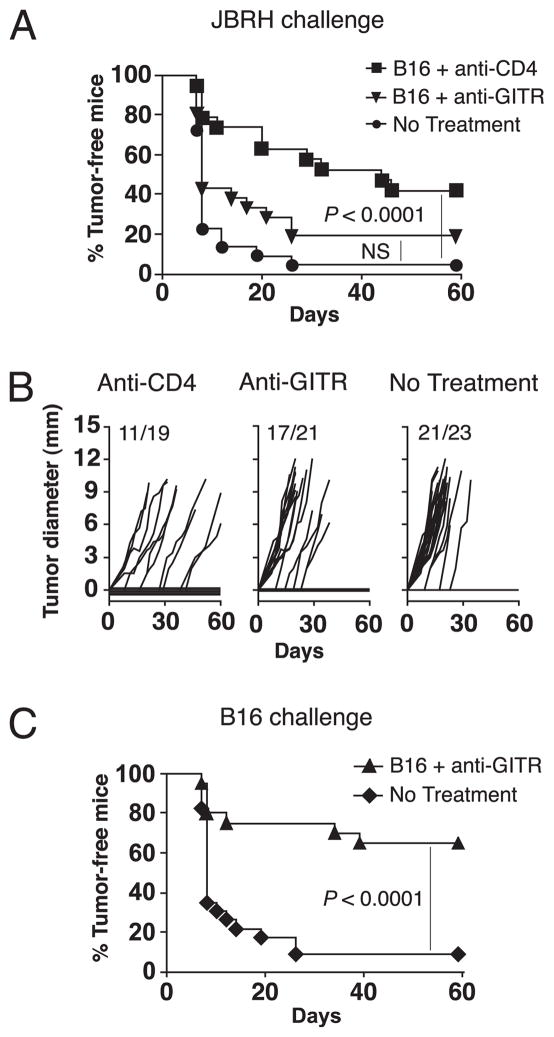
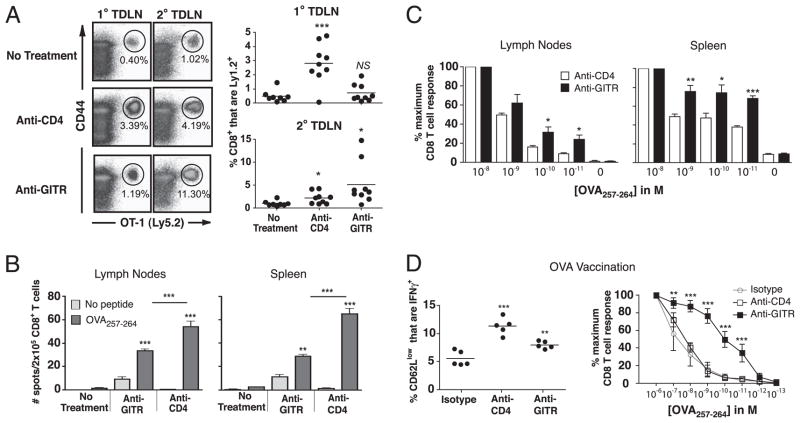
Treatment of tumor-bearing mice with a stimulatory Ab to glucocorticoid-induced TNFR family-related receptor (GITR) has previously been shown to elicit protective T cell responses against poorly immunogenic tumors. However, the role of GITR stimulation on CD8 T cells and the nature of tumor rejection Ags have yet to be determined. In this study, we show that a stimulatory mAb to GITR (clone DTA-1) acts directly on CD8 T cells, but not on CD4(+)CD25(+) regulatory T (T(reg)) cells, in B16 tumor-bearing mice to induce concomitant immunity against secondary B16 tumors, as well as protective memory following surgical excision of the primary tumor. Melanoma growth itself induced GITR expression on tumor-specific CD8 T cells, providing a mechanism whereby these cells may respond to stimulatory anti-GITR. Unexpectedly, in contrast to T(reg) cell depletion therapy with anti-CD4, GITR stimulation induced very weak CD8 T cell responses to melanocyte differentiation Ags expressed by the tumor, and did not induce autoimmune vitiligo. Accordingly, GITR-stimulated hosts that were primed with B16 melanoma rejected B16, but not the unrelated JBRH melanoma, indicating that tumor rejection Ags are tumor-specific rather than shared. In support of this, we show that GITR stimulation induces CD8 T cell responses to a tumor-specific Ag, and that these responses are of higher functional avidity compared with those induced by T(reg) cell depletion. We conclude that stimulation of GITR on effector CD8 T cells results in high-avidity T cell responses to tumor-specific Ags, thereby inducing potent antitumor immunity in the absence of autoimmunity.


Conflict of interest statement

Disclosures

The authors have no financial conflicts of interest.

Figures

FIGURE 1
FIGURE 1
GITR stimulation induces concomitant and postsurgical immunity against B16 melanoma. A, Concomitant immunity. Mice were treated according to the timeline. Growth curves of primary and challenge tumors, as well as control tumors (mice receiving anti-GITR but no primary tumor), are depicted, with tumor incidence represented as numerical fractions. Significance was determined by comparing growth of challenge and control tumors. B, Postsurgical immunity. Mice were treated according to the timeline and as specified in the legend. Incidence of challenge tumors is depicted. C, CD8 T cells are required for postsurgical immunity. Mice were treated according to the timeline in B, and as specified in the legend. Anti-CD8 and anti-NK1.1 treatments were administered starting 1 d before surgery and weekly thereafter. A and B each involved 10–16 mice/group and were performed twice with similar results. C depicts combined data from two separate experiments. NS, p > 0.05.
FIGURE 2
FIGURE 2
Stimulation of GITR on CD8 effector T cells is required for optimal concomitant tumor immunity. A, RAG−/− mice were adoptively transferred with total naive splenocytes containing either wild-type or GITR−/− CD8 T cells and then inoculated with B16 tumors and treated with anti-GITR according to the timeline in Fig. 1A. Primary and challenge tumor incidence is depicted. Data are combined from two separate experiments involving 12–15 mice/group. B, GITR−/− CD8 T cells are functional. Wild-type or GITR−/− mice were “primed” by inoculation of primary B16 tumors on day 0 and treatment with anti-CD4 on days 4 and 10. Incidence of challenge tumors, inoculated on day 6, is depicted. Anti-CD8 treatment was administered starting 1 d before challenge and weekly thereafter. C, RAG−/− mice were reconstituted with naive wild-type splenocytes containing CD4+CD25+ Treg cells from either wild-type or GITR−/− mice and then inoculated with B16 tumors and treated with anti-GITR according to the timeline in Fig. 1A. B6 control mice only received challenge tumors. Primary and challenge tumor incidence is depicted. Data are combined from two separate experiments involving 10–24 mice/group.
FIGURE 3
FIGURE 3
Tumor growth induces GITR expression on tumor Ag-specific CD8 T cells. Mice were inoculated with tumors and, when tumors were 6–8 mm in diameter, were adoptively transferred with 106 naive, congenically marked transgenic T cells. A, Mice received pmel T cells and wild-type B16 tumors. B, Mice received OT-1 T cells and B16-OVA tumors. For A and B, flow cytometry was performed to detect GITR expression on transferred T cells in lymph nodes at the indicated time points. Histograms (left) depict GITR expression on congenically marked transgenic T cells versus host CD8+ cells in tumor-draining lymph nodes of representative mice. Graphs (right) depict summarized data, with symbols representing individual mice and horizontal lines representing averages. Asterisks represent statistical differences between mean fluorescence intensity (MFI) of GITR expression on transgenic T cells (pmel or OT-1) as compared with host CD8 T cells: *p < 0.05; **p < 0.01; ***p < 0.001. Experiments were repeated at least twice with similar results.
FIGURE 4
FIGURE 4
GITR stimulation induces protective postsurgical memory in the absence of autoimmunity. Mice received primary B16 tumors, anti-GITR, or anti-CD4 treatment on days 4 and 10 and surgery to remove primary tumors on day 12. A, Incidence and level of autoimmune de-pigmentation 30 d post-surgery. Images depict representative mice treated with anti-CD4 that developed local (left) or disseminated (right) de-pigmentation. Experiment was performed five times with similar results. B, Mice were challenge with B16 melanoma 30 d after surgery and incidence of challenge tumors is depicted. Experiment involved 10–16 mice/group.
FIGURE 5
FIGURE 5
GITR stimulation during melanoma progression induces weak CD8 T cell responses to Ags. A and B, Mice received primary and challenge B16 tumors on days 0 and 6 and received either anti-GITR or anti-CD4 on days 4 and 10. On day 15, IFN-γ ELISPOT was performed on CD8+ T cells (six mice per group) from (A) pooled lymph nodes and spleens or (B) spleens taken from individual mice. EL4 cells pulsed with peptides described in the legend were used as targets. Data represent averages of four replicate wells per sample; error bars represent standard deviations. *p < 0.05; **p < 0.01; ***p < 0.001 compared with irrelevant (OVA) peptide. C and D, Mice received 106 naive Thy1.1+ pmel T cells on day −1 and primary B16 tumors in Matrigel on days 0 and 6 either alone (no treatment) or with anti-CD4 or anti-GITR on days 4 and 10. Flow cytometry was performed on day 12 to detect pmel cells. C, Representative data from one mouse in each treatment group; gated on live CD8+ T cells. D, Summary of data; y-axis represents percentages of pmel cells (Thy1.1+) among total CD8+ T cells in live lymphocyte gate. Each point represents a single mouse, and horizontal lines represent averages. *p < 0.05; **p < 0.01, relative to no treatment. Each experiment was performed at least twice with similar results.
FIGURE 6
FIGURE 6
Tumor rejection Ags in GITR-stimulated hosts are tumor-specific rather than shared. Mice received primary B16 tumors on day 0, anti-GITR or anti-CD4 treatment on days 4 and 10, and surgery to remove primary tumors on day 12. A, Incidence of JBRH challenge tumors inoculated 1 d post-surgery. B, Growth kinetics of JBRH challenge tumors; numerical fractions represent tumor incidence. C, Incidence of B16 challenge tumors inoculated 1 d post-surgery. Data represent two combined experiments, where each experiment involved 8–12 mice/group. NS, p > 0.05.
FIGURE 7
FIGURE 7
GITR stimulation induces high-avidity T cell responses to a tumor-specific Ag. A, Mice received 106 Ly5.2+ OT-1 T cells on day −1 and primary B16-OVA on days 0 and 6 either alone (no treatment) or with anti-CD4 or anti-GITR on days 4 and 10. Flow cytometry was performed on day 12 to detect OT-1 cells. Left, Representative data from one mouse in each treatment group; gated on live CD8+ T cells. Right, Summary of data; y-axis represents percentages of Ly5.2+ OT-1 cells among total CD8+ T cells in live lymphocyte gate. Symbols represent individual mice, horizontal lines represent averages, and asterisks represent statistical significance relative to untreated control. Data represent two combined experiments. B and C, Mice were inoculated with B16-OVA tumors on days 0 and 6 and were left untreated or were treated with anti-GITR or anti-CD4 on days 4 and 10. On day 15, IFN-γ ELISPOT was performed on purified CD8 T cells from pooled spleens (six mice per group). EL4 cells pulsed with no peptide or with OVA were used as targets, as specified in the legend. B, GITR stimulation increases T cell functional avidity. The percentage of CD8 T cells secreting IFN-γ at decreasing peptide concentrations, normalized relative to the maximal response, is shown. Statistical differences (asterisks) were calculated between anti-CD4 and anti-GITR groups. D, Mice were vaccinated in the footpad with 10 μg OVA257 peptide emulsified in TiterMax and treated with anti-CD4 (day 0), LTF2 isotype control mAb (day 0), or anti-GITR (days 1 and 3). On day 5, cells pooled from lymph nodes were restimulated with the specified concentration of OVA peptide and the percentage of Ag-experienced CD8 T cells secreting IFN-γ was determined by flow cytometry. The y-axis represents the percentage of CD3+CD8+ CD44hiCD62Llow cells secreting IFN-γ when restimulated with 1 μM OVA peptide. Left, Each point represents a single mouse, horizontal lines represent averages, and asterisks represent statistical significance relative to isotype control. Right, Data were normalized relative to the maximal response at the highest peptide concentration. Symbols represent the average of five mice per group, and error bars represent standard deviations. Each experiment was conducted at least twice with similar results. *p < 0.05; **p < 0.01; ***p < 0.001.

References

    1. Wood LD, Parsons DW, Jones S, Lin J, Sjöblom T, Leary RJ, Shen D, Boca SM, Barber T, Ptak J, et al. The genomic landscapes of human breast and colorectal cancers. Science. 2007;318:1108–1113. - PubMed
    1. Monach PA, Meredith SC, Siegel CT, Schreiber H. A unique tumor antigen produced by a single amino acid substitution. Immunity. 1995;2:45–59. - PubMed
    1. Neller MA, López JA, Schmidt CW. Antigens for cancer immunotherapy. Semin Immunol. 2008;20:286–295. - PubMed
    1. Duan F, Lin Y, Liu C, Engelhorn ME, Cohen AD, Curran M, Sakaguchi S, Merghoub T, Terzulli S, Wolchok JD, Houghton AN. Immune rejection of mouse tumors expressing mutated self. Cancer Res. 2009;69:3545–3553. - PMC - PubMed
    1. Prehn RT, Main JM. Immunity to methylcholanthrene-induced sarcomas. J Natl Cancer Inst. 1957;18:769–778. - PubMed

Publication types

MeSH terms

Substances