. 2011 Feb;300(2):F561-73.
doi: 10.1152/ajprenal.00282.2010. Epub 2010 Nov 24.

The rat kidney contains high levels of prouroguanylin (the uroguanylin precursor) but does not express GC-C (the enteric uroguanylin receptor)

Affiliations

The rat kidney contains high levels of prouroguanylin (the uroguanylin precursor) but does not express GC-C (the enteric uroguanylin receptor)

Xun Qian et al. Am J Physiol Renal Physiol. 2011 Feb.

Abstract

The peptide uroguanylin (Ugn) regulates enteric and renal electrolyte transport. Previous studies have shown that Ugn and its receptor GC-C (a ligand-activated guanylate cyclase) are abundant in the intestine. Less is known about Ugn and GC-C expression in the kidney. Here, we identify a 9.4-kDa polypeptide in rat kidney extracts that appears, based on its biochemical and immunological properties, to be authentic prouroguanylin (proUgn). This propeptide is relatively plentiful in the kidney (~16% of intestinal levels), whereas its mRNA is marginally present (<1% of intestinal levels), and free Ugn peptide levels are below detection limits (<0.4% of renal proUgn levels). The paucity of preproUgn-encoding mRNA and free Ugn peptide raises the possibility that the kidney might absorb intact proUgn from plasma, where the concentration of propeptide greatly exceeds that of Ugn. However, immunocytochemical analysis reveals that renal proUgn is found exclusively in distal tubular segments, sites previously shown not to accumulate radiolabeled proUgn after intravascular infusions. Thus proUgn appears to be synthesized within the kidney, but the factors that determine its abundance (rates of transcription, translation, processing, and secretion) must be balanced quite differently than in the gut. Surprisingly, we also find negligible expression of GC-C in the rat kidney, a result confirmed both by RT-PCR and by functional assays that measure Ugn-activated cGMP synthesis. Taken together, these data provide evidence for an intrarenal Ugn system that differs from the well-described intestinal system in its regulatory mechanisms and in the receptor targeted by the peptide.


Figures

Fig. 1.
Fig. 1.
Relative preprouroguanylin (preproUgn) mRNA and proUgn polypeptide levels in rat small intestine and kidney. A: Northern analysis of serial dilutions of total RNA obtained from jejunum and kidney, using a preproUgn-specific probe. The strengths of the hybridization signals were measured in a phosphorimager. RNA was obtained from 4 independent samples of each tissue (each taken from a different animal), and the results are plotted as means ± SE. Specific activities of preproUgn mRNA (probe hybridized per μg of RNA) were determined from the slopes of lines fit to the linear portions of the dilution curves, and the jejunum (J):kidney (K) ratio was calculated from these slopes. Inset: 5-day film exposures from a standard Northern blot performed on 40 μg of total RNA, visually confirming the presence of a very low abundance preproUgn transcript in the rat kidney. B: Western blot analysis of serial dilutions of representative protein samples from jejunum and kidney, performed with antibody 6910. Chemiluminescent signals were captured on film, digitized on a flatbed scanner, and quantified with NIH Image software. Values obtained from 5 independent tissue samples (each taken from a different animal) were averaged and plotted, as shown (means ± SE). Specific activities of proUgn polypeptide in each tissue (chemiluminescent signal/μg of protein) were calculated as described above. Inset: individual blots performed on 40 μg of total protein, illustrating the relatively abundant polypeptide signal in the kidney.
Fig. 2.
Fig. 2.
ProUgn-like polypeptide in kidney has immunological and biochemical properties consistent with those of authentic, full-length proUgn. A: schematic of the proUgn molecule (9.4 kDa), drawn to scale, showing the regions targeted by the 4 antibodies used in this study (6910, 6911, 6912, and 1–11). Ugn (1.6 kDa) is derived from the C terminus of the propeptide and thus is recognized by antibody 1–11 but not by the other 3 antibodies. B: Western blots of intestinal and kidney extracts, using anti-proUgn antibodies 6910, 6911, and 6912. Blots are cropped to focus on the 2- to 20-kDa region of the gel, with 9.4 kDa marked by the arrowhead. C and D: HPLC analysis of renal and jejunal extracts, respectively. The solid line denotes the UV absorbance profile, and the inset shows an aligned Western blot analysis of individual fractions. The retention time of recombinant rat proUgn is indicated by the arrowheads in each chromatogram. E: Western blot of mouse kidney extracts, using antibody 6910. Tissues were obtained from wild-type (+/+) and uroguanylin knockout (−/−) animals, as indicated. Blots are cropped to focus on the 2- to 20-kDa region of the gel, with 9.4 kDa marked by the arrowhead.
Fig. 3.
Fig. 3.
Rat kidney extracts do not contain detectable amounts of Ugn. A: reverse-phase HPLC was used to fractionate a kidney extract (white symbols) or a kidney extract spiked with 10 nmol of synthetic rat Ugn (black symbols). After chromatography, individual HPLC fractions were dried, resuspended in assay buffer, and analyzed for Ugn-like binding activity as described in methods. White symbols plotted for fractions 39–45 represent mean results from 7 independent column runs, each based on an extract from an independent kidney. Authenticated peptide standards elute at the points indicated by the black arrowheads. B: quantitative Western blot assay for proUgn, using antibody 6910. The right half of the gel contains samples from 5 independent kidney extracts (AE). The left half of the gel contains a standard curve constructed with known amounts of recombinant rat proUgn, as indicated.
Fig. 4.
Fig. 4.
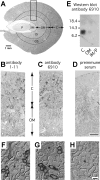
Immunoperoxidase staining for proUgn in rat kidney. A: hematoxylin- and eosin-stained thin section (for reference). The dotted lines indicate the approximate boundaries between cortex (C), outer medulla (OM), inner medulla (IM), and papilla (P). The OM can be further subdivided into the inner stripe (IS) and the outer stripe (OS). The boxed region indicates the approximate locations and orientations of images in BD. Tissue section immunostained with antibody 1–11 (B) or antibody 6910 (C). D: preimune serum control for antibody 6910. Preimmune serum was not available for antibody 1–11. E: Western blot of extracts obtained from hand-dissected subregions of kidney, including cortex (C), outer medulla (OM), and combined inner medulla and papilla (IM/P). F and G: higher magnification views of proUgn immunostaining in kidney cortex. Asterisks denote unstained glomeruli. Immunostaining was performed with antibody 1–11 (F), antibody 6910 (G), or preimmune serum (H) obtained from the same animal that was used to produce antibody 6910.
Fig. 5.
Fig. 5.
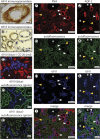
Additional features of proUgn immunostaining in kidney. A: immunoperoxidase-stained tubule labeled with antibody 6910, viewed with differential interference contrast optics. The brown reaction product is restricted to the cytoplasm of the epithelial cells that form the tubule. The nuclei of the labeled cells are in close proximity to the apical membrane. B: immunoperoxidase-stained section labeled with antibody 6910 and lightly counterstained with hematoxylin to reveal cellular features. Immunoreactive tubules are light brown, while immunonegative tubules are gray-blue. As in B, the reaction product is intracellular, and the immunopositive cells have apically oriented nuclei. C: superimposed double-label fluorescence images of kidney cortex stained with anti-proUgn antibody 6910 (blue) and anti-CD 26 antibody (red). D and E: superimposed fluorescence images of kidney cortex showing autofluorescence (green) and proUgn-like immunoreactivity (blue) as detected by anti-proUgn antibody 6910 (D) or anti-proUgn antibody 6911 (E). Peanut agglutinin (PNA) binding (F), autofluorescence (G), and proUgn-like immunoreactivity (H) are shown in a section of kidney cortex. I: superimposed images FH. Aquaporin-2 (AQP2)-like immunoreactivity (J), autofluorescence (K), and proUgn-like immunoreactivity (L) are shown in a section of kidney cortex. M: superimposed images JL. Scale bars = 10 μm (A), 30 μm (BE), and 50 μm (FM). Asterisks mark unstained glomeruli.
Fig. 6.
Fig. 6.
RT-PCR evaluation of receptor guanylate cyclase C (GC-C) expression in rat intestine and kidney. Primer sequences are given in Table 1. A: endpoint amplification of GC-C or cyclophilin A, using primer sets A and D, respectively, and RNA obtained from jejunum (J) or kidney (K). To derive semiquantitative information from this method, multiple aliquots of each sample were processed in parallel, and individual reaction tubes were removed from the thermocycler at specified cycle times, as described in the text. Results are shown for GC-C after 40 cycles and for cyclophilin after 27 cycles. B: cycle threshold (CT) values were determined for real-time RT-PCR amplification of GC-C with primer set B (white bars) or β-actin with primer set C (gray bars) using RNA obtained from jejunum (J; means ± SE, n = 12) or kidney (K; means ± SE, n = 24). Relative abundances (Ugn-to-actin ratios) for each tissue are shown by the black bars.
Fig. 7.
Fig. 7.
Ugn does not stimulate renal synthesis or urinary excretion of cGMP. A: sequential urine samples were collected before, during, and after infusion with atrial natriuretic peptide (ANP; 7 nmol·h−1·kg body wt−1, white symbols, means ± range, n = 2), human Ugn A (25 nmol·h−1·kg body wt−1, black symbols, means ± SE, n = 3), or human Ugn B (50 nmol·h−1·kg body wt−1, gray symbols, means ± SE, n = 3). Peptides were infused during the interval marked by the horizontal bar. Urinary cGMP concentrations were measured by radioimmunoassay, and excretion rate (normalized to kidney weight) was calculated as the product of urine concentration and urine volume divided by the length of the collection period. Time control experiments with vehicle infusion (n = 5, data not shown) gave results indistinguishable from those illustrated for the Ugn infusions. B: urinary excretion of Ugn (white symbols) or cGMP (black symbols) in sequential 60-min urine samples collected before, during, and after infusion with proUgn (10 nmol·h−1·kg body wt−1). Urinary cGMP and Ugn concentrations were measured by radioimmunoassay and competitive binding assay, respectively. Excretion rates were calculated as in A. C: rate of cGMP synthesis by kidney membranes obtained from isolated cortex (white bars), medulla (gray bars), or papilla (black bars). Membranes, substrate (GTP), cofactors, and peptide (or vehicle) were mixed at time 0, and then duplicate samples were removed and quenched with 6% TCA at 5 and 10 min. Accumulated cGMP was measured at each time point by radioimmunoassay, and the rate of synthesis was calculated from the slope of a line fit to the data points by linear regression.

Similar articles

Cited by

References

    1. Amorim JB, Musa-Aziz R, Lessa LM, Malnic G, Fonteles MC. Effect of uroguanylin on potassium and bicarbonate transport in rat renal tubules. Can J Physiol Pharmacol 84: 1003–1010, 2006 - PubMed
    1. Blanchard RK, Cousins RJ. Upregulation of rat intestinal uroguanylin mRNA by dietary zinc restriction. Am J Physiol Gastrointest Liver Physiol 272: G972–G978, 1997 - PubMed
    1. Carrithers SL, Hill MJ, Johnson BR, O'Hara SM, Jackson BA, Ott CE, Lorenz J, Mann EA, Giannella RA, Forte LR, Greenberg RN. Renal effects of uroguanylin and guanylin in vivo. Braz J Med Biol Res 32: 1337–1344, 1999 - PubMed
    1. Carrithers SL, Ott CE, Hill MJ, Johnson BR, Cai WY, Chang JJ, Shah RG, Sun CM, Mann EA, Fonteles MC, Forte LR, Jackson BA, Giannella RA, Greenberg RN. Guanylin and uroguanylin induce natriuresis in mice lacking guanylyl cyclase-C receptor. Kidney Int 65: 40–53, 2004 - PubMed
    1. Carrithers SL, Taylor B, Cai WY, Johnson BR, Ott CE, Greenberg RN, Jackson BA. Guanylyl cyclase-C receptor mRNA distribution along the rat nephron. Reg Pept 95: 65–74, 2000 - PubMed

Publication types

MeSH terms

LinkOut - more resources