. 2011 Mar;25(3):948-59.
doi: 10.1096/fj.10-173906. Epub 2010 Nov 24.

A mitochondrial enzyme degrades carotenoids and protects against oxidative stress

Affiliations

A mitochondrial enzyme degrades carotenoids and protects against oxidative stress

Jaume Amengual et al. FASEB J. 2011 Mar.

Abstract

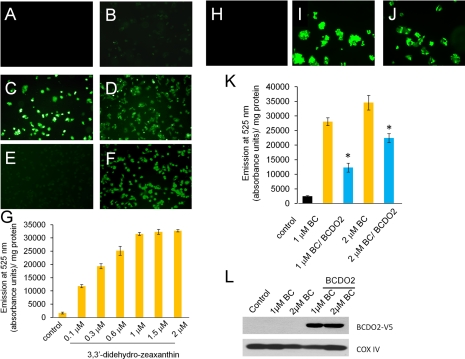
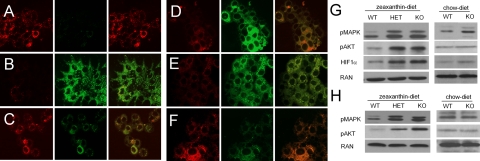
Carotenoids are the precursors for vitamin A and are proposed to prevent oxidative damage to cells. Mammalian genomes encode a family of structurally related nonheme iron oxygenases that modify double bonds of these compounds by oxidative cleavage and cis-to-trans isomerization. The roles of the family members BCMO1 and RPE65 for vitamin A production and vision have been well established. Surprisingly, we found that the third family member, β,β-carotene-9',10'-oxygenase (BCDO2), is a mitochondrial carotenoid-oxygenase with broad substrate specificity. In BCDO2-deficient mice, carotenoid homeostasis was abrogated, and carotenoids accumulated in several tissues. In hepatic mitochondria, accumulated carotenoids induced key markers of mitochondrial dysfunction, such as manganese superoxide dismutase (9-fold), and reduced rates of ADP-dependent respiration by 30%. This impairment was associated with an 8- to 9-fold induction of phosphor-MAP kinase and phosphor-AKT, markers of cell signaling pathways related to oxidative stress and disease. Administration of carotenoids to human HepG2 cells depolarized mitochondrial membranes and resulted in the production of reactive oxygen species. Thus, our studies in BCDO2-deficient mice and human cell cultures indicate that carotenoids can impair respiration and induce oxidative stress. Mammalian cells thus express a mitochondrial carotenoid-oxygenase that degrades carotenoids to protect these vital organelles.


Figures

Figure 1.
Figure 1.
BCDO2 is a mitochondrial protein that metabolizes xanthophylls. A) COS7 cells expressing murine BCDO2 with a V5 tag. Immunostaining was performed using anti-V5 antibody for BCDO2 (left panel) and anti-COXIV antibody (middle panel). Merged image (right panel) shows mitochondrial colocalization of BCDO2 with COXIV. Scale bar = 10 μm. B, C) HPLC profiles at 420 nm of a lipid extract from in vitro tests for BCDO2 enzymatic activity. Reaction was carried out with 20 μM zeaxanthin (B) and lutein (C) at 28°C for 10 s (red trace) and 10 min (blue trace). Insets: enlargement of sectors of peaks 1 (3-OH-β-10′-apocarotenal) and 2 (rosafluene) (B) and peaks 1′ (3-OH-ε-10′-apocarotenal), 2′ (3-OH-β-10′-apocarotenal), and 3′ (rosafluene) (C). Spectral characteristics of peaks are presented above HPLC traces. D) Mass spectra from peaks 1and 2′. Note that 3-OH-ε-10′-apocarotenal loses water on ionization. Therefore, m/z = 375.4 MZ is the dominant ion.
Figure 2.
Figure 2.
BCDO2−/− mice accumulate 3,3′-didehydrozeaxanthin and 3-dehydrolutein. A) Representative close-up images of the internal organs of a BCDO2−/− mouse fed a diet supplemented with lutein (left panel), a WT control mouse fed a diet supplemented with lutein (middle panel) and a BCDO2−/− mouse fed a diet supplemented with zeaxanthin (right panel). B) HPLC profiles at 460 nm of lipid extracts of livers from WT (red trace) and BCDO2−/− mice (blue trace) fed the zeaxanthin-supplemented diet. Insets: spectral characteristics of 3,3′-didehydrozeaxanthin (peak 1) and parent zeaxanthin (peak 2). C) HPLC profiles at 460 nm of lipid extracts of livers from WT (red trace) and BCDO2−/− mice (blue trace) fed a diet supplemented with lutein. Insets: spectral characteristics of 3-dehydrolutein metabolites (peaks 1′–3′) and parent lutein (peak 4′). Two of these compounds were identified by MS analysis (see Fig. 3B). D) Molar amounts of zeaxanthin and 3,3′-didehydrozeaxanthin in the serum, liver, and heart of WT, BCDO2-HET, and BCDO2-KO mice. Carotenoid content (CAR) was determined by HPLC analysis. Values represent means ± sd of 5 animals.
Figure 3.
Figure 3.
Identification of zeaxanthin and lutein metabolites in liver of BCDO2−/− mice. A) Carotenoid metabolites present in BCDO2-KO mice gavaged with zeaxanthin. 1–3) Single tall peak detected at 450 nm (panel 1) corresponds to a compound with molecular mass of 564.5 (m/z=565.5 [MH]+; panel 2) and absorbance spectrum shown (panel 3). 4) MS/MS spectra obtained for this ion. B) Identification of lutein metabolites. 1) HPLC chromatogram recorded at 450 nm. 2, 3) Small broad peak seen by absorbance reveals presence of 2 compounds with molecular mass of 548.5 and 564.5 (detected as [MH+] ions) as observed in MS spectrum (panel 2) and extracted ion chromatogram (panel 3). 4) Both compounds share a similar absorbance spectrum characterized by their distinctive absorbance maxima. 5, 6) Chemical structures of the detected compounds with molecular masses of 548.5 (panel 5) and 564.5 (panel 6) were deducted from MS/MS fragmentation spectra.
Figure 4.
Figure 4.
Carotenoid accumulation impairs mitochondrial function. A) Expression of BCDO2 mRNA in the liver of WT, BCDO2-HET, and BCDO2-KO mice subjected to different dietary interventions. Values represent means ± sd from 5 mice/group. n.d., not detectable. *P ≤ 0.05. B) Representative liver sections (×20) of WT, HET, and KO mice subjected to different dietary interventions. C) Liver triacylgylceride levels of WT, HET, and KO mice subjected to zeaxanthin diet. Values not sharing a common letter (a, b) are statistically different (P<0.05); 1-way ANOVA and LSD post hoc comparison. D) Colors of isolated hepatic mitochondria of BCDO2−/− and WT mice fed a diet supplemented with diet. HPLC trace at 420 nm of a lipophilic extract of isolated hepatic WT (bottom trace) and BDCO2-deficient (top trace) mitochondria. Peaks 1–3 show spectral characteristics identical to those of 3-dehyrolutein derivatives depicted in Fig. 2C. E) Immunoblot analysis for MnSOD with protein extracts from hepatic mitochondria (50 μg protein/lane). Staining for COXIV was used as a loading control. F) Oxygen consumption of complexes I–IV in isolated hepatic mitochondria from age-matched male BCDO2−/− mice fed lutein diet vs. control diet. Oxygen consumption was measured by the addition of complexes I–IV (see Materials and Methods) in the presence of 100 mM ADP to determine maximal ADP-dependent respiration rates. *P ≤ 0.05.
Figure 5.
Figure 5.
Carotenoids induce ROS production in HepG2 cells. A–F) HepG2 cells were treated with vehicle only (A), 2 μM zeaxanthin (B), 0.5 μM 3,3′-didehydrozeaxanthin (C), 2 μM 3,3′-didehydrozeaxanthin (D), 2 μM lutein (E), or 2 μM dihydrolutein derivatives (F). After 2 h of incubation, the nonfluorescent carboxy-H2DCFDA dye was added to treated cells. In the presence of ROS, the reduced fluorescein compound is oxidized and emits bright green fluorescence. Representative images were taken under a fluorescent microscope at ×20. G) HepG2 cells were treated with increasing amounts of 3,3′-didehydrocarotenoids (0.1, 0.3, 0.6, 1.0, 1.5, and 2 μM), respectively. Treated cells were harvested by centrifugation and resuspended in 1× PBS. Fluorescence was determined by emission of light at 525 nm and measured in absorbance units per milligram of protein. Assay was performed in duplicate and repeated 3 times. H, I) HepG2 cells were treated with vehicle only (H) or 2 μM of β,β-carotene (I). J) HepG2 cells were transfected with a vector for the expression of murine BCDO2. After 2 d, cells were treated with 2 μM of β,β-carotene. After 2 h, nonfluorescent carboxy-H2DCFDA dye was added to treated cells (H–J). Representative images were taken under a fluorescent microscope at ×40. K) Nontransfected HepG2 cells and HepG2 cells transfected with a plasmid for recombinant murine BCDO2 expression were treated with different amounts of β,β-carotene. After 2 h, nonfluorescent carboxy-H2DCFDA dye was added, and cells were harvested by centrifugation and redissolved in 1× PBS. Fluorescence was determined by emission of light at 525 nm. Data represent values from 3 experiments. *P < 0.05. L) Immunoblot analysis of HepG cells from K confirms the expression of recombinant murine V5-tagged BCDO2. In addition, levels of the mitochondrial marker protein COXIV indicate that amounts of mitochondria are not grossly altered on overexpression of recombinant BCDO2.
Figure 6.
Figure 6.
Carotenoids can depolarize mitochondrial membrane potential in HepG2 cells and induce signaling pathways related to oxidative stress in mice. A–F) HepG2 cells were treated with vehicle (A), 5 μM carbonylcyanide m-chlorophenylhydrazone as positive control (B), 2 μM zeaxanthin (C), 2 μM 3,3′-didehydrozeaxanthin (D), and 1 μM β,β-carotene (E) or were transfected with a plasmid for the expression of recombinant murine BCDO2 prior to treatment with 1 μM β,β-carotene (F). After 2 h of incubation, mitochondrial membrane potential was assessed by JC-1 stain. Cells were visualized under a confocal fluorescent microscope. Red fluorescence of JC-1 aggregates shows distribution of intact mitochondria (left panels). Green fluorescence of JC-1 monomers indicates mitochondria with depolarized membrane potential (middle panels). Merged images show overlays of the left and middle panel (right panels). Data were obtained from ≥3 independent experiments. Images were taken at ×20. G, H) Analysis of key protein markers of stress-regulated pathways, known to be induced by ROS, in liver (G) and heart (H) of age- and sex-matched animals subjected to either zeaxanthin diet or chow diet. Expression levels of phospho-MAPK 44/42 (pMAPK), phospho-AKT Ser473 (pAKT), and HIF1α were analyzed by immunoblot analysis in age-matched WT, BCDO2-HET, or BCDO2-KO animals. Fifty micrograms of protein was loaded per lane. Each lane represents pooled samples from 5 animals. Ras-related nuclear protein (RAN) was used as loading control.

References

    1. Demmig-Adams B., Adams W. W., 3rd. (2002) Antioxidants in photosynthesis and human nutrition. Science 298, 2149–2153 - PubMed
    1. Bernstein P. S., Yoshida M. D., Katz N. B., McClane R. W., Gellermann W. (1998) Raman detection of macular carotenoid pigments in intact human retina. Invest. Ophthalmol. Vis. Sci. 39, 2003–2011 - PubMed
    1. Snodderly D. M., Handelman G. J., Adler A. J. (1991) Distribution of individual macular pigment carotenoids in central retina of macaque and squirrel monkeys. Invest. Ophthalmol. Vis. Sci. 32, 268–279 - PubMed
    1. Krinsky N. I., Landrum J. T., Bone R. A. (2003) Biologic mechanisms of the protective role of lutein and zeaxanthin in the eye. Annu. Rev. Nutr. 23, 171–201 - PubMed
    1. Moise A. R., von Lintig J., Palczewski K. (2005) Related enzymes solve evolutionarily recurrent problems in the metabolism of carotenoids. Trends Plant Sci. 10, 178–186 - PubMed

Publication types

MeSH terms