. 2011 Mar 24;117(12):3311-9.
doi: 10.1182/blood-2010-08-302729. Epub 2010 Nov 24.

Assessing the potential for AAV vector genotoxicity in a murine model

Affiliations

Assessing the potential for AAV vector genotoxicity in a murine model

Hojun Li et al. Blood. .

Erratum in

  • Blood. 2011 Jun 16;117(24):6739

Abstract

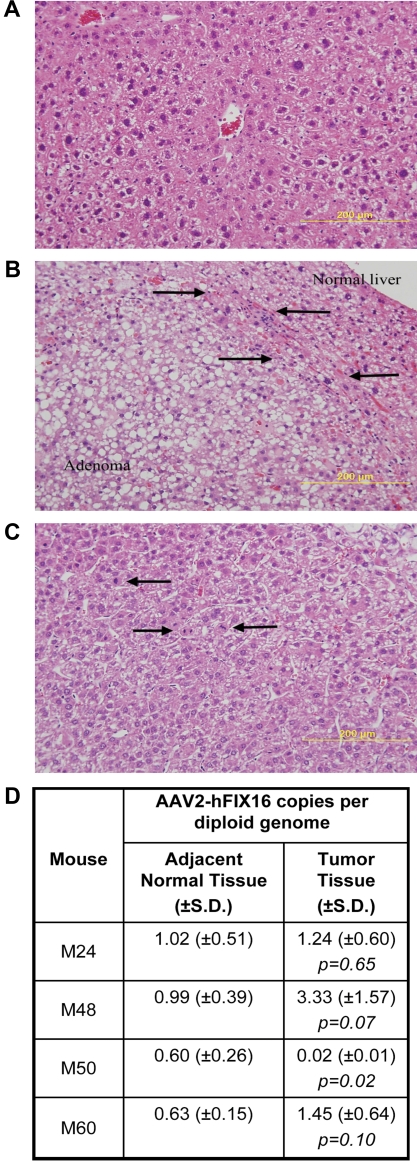
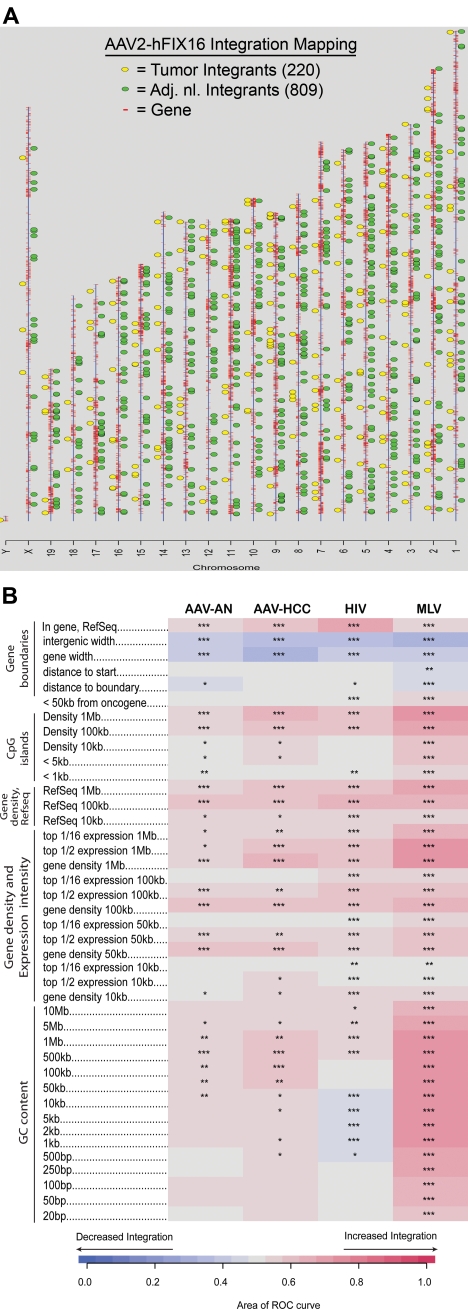
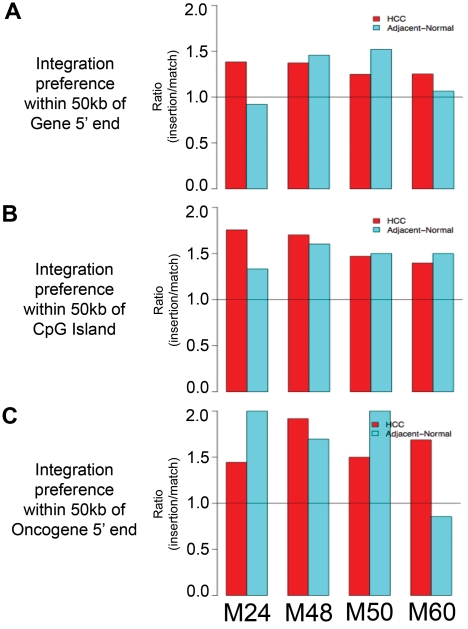
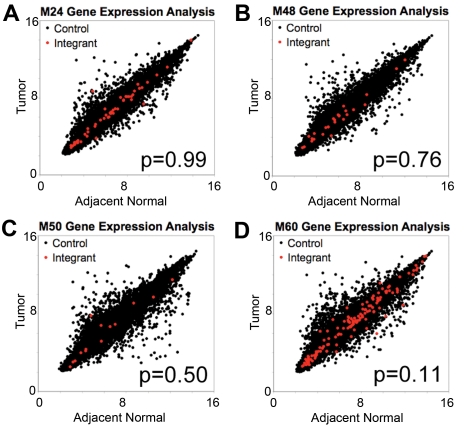
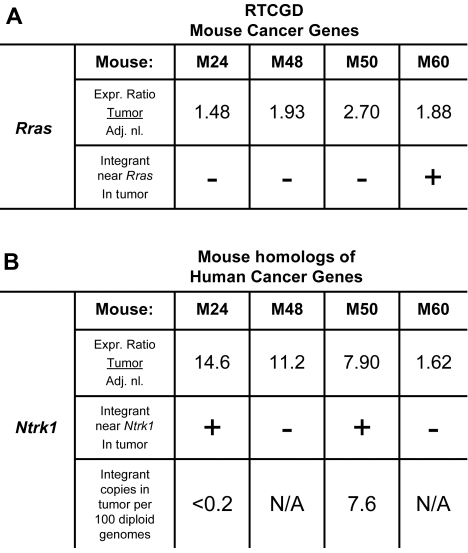
Gene transfer using adeno-associated virus (AAV) vectors has great potential for treating human disease. Recently, questions have arisen about the safety of AAV vectors, specifically, whether integration of vector DNA in transduced cell genomes promotes tumor formation. This study addresses these questions with high-dose liver-directed AAV-mediated gene transfer in the adult mouse as a model (80 AAV-injected mice and 52 controls). After 18 months of follow-up, AAV-injected mice did not show a significantly higher rate of hepatocellular carcinoma compared with controls. Tumors in mice treated with AAV vectors did not have significantly different amounts of vector DNA compared with adjacent normal tissue. A novel high-throughput method for identifying AAV vector integration sites was developed and used to clone 1029 integrants. Integration patterns in tumor tissue and adjacent normal tissue were similar to each other, showing preferences for active genes, cytosine-phosphate-guanosine islands, and guanosine/cytosine-rich regions. [corrected] Gene expression data showed that genes near integration sites did not show significant changes in expression patterns compared with genes more distal to integration sites. No integration events were identified as causing increased oncogene expression. Thus, we did not find evidence that AAV vectors cause insertional activation of oncogenes and subsequent tumor formation.


Figures

Figure 1
Figure 1
HCC tissue differs histopathologically from normal and adenomatous liver tissue but has no difference in vector genome copy number. Hematoxylin and eosin–stained sections for histopathologic diagnosis of (A) normal liver; (B) hepatic adenoma, arrows denote zone of compression between adenoma and normal liver; and (C) hepatocellular carcinoma, arrows indicate mitotic figures. Images were captured with the use of a Zeiss Axiophot microscope (Carl Zeiss Imaging, Inc) with a 20×, 0.40 aperture EC PLAN NEOFLUAR objective lens at room temperature. Images were acquired with the use of an Olympus DP70 (Olympus America Inc) camera and DP Manager Version 1.21.107 software, with subsequent image cropping performed with Adobe Photoshop. (D) AAV2-hFIX16 vector genome copy number in tumor and normal liver was quantified by qPCR, performing 3 independent measurements on total DNA isolated from tumor and normal liver tissue. P values from 2-tailed Student t test between 3 independent measurements of adjacent normal liver tissue and tumor tissue.
Figure 2
Figure 2
Vector integration site distribution and preferences in normal and tumor tissues. (A) Ideogram of integration patterns from hepatocellular carcinoma and adjacent normal datasets across mouse genome. (B) Genomic heatmap of integration frequency relative to genomic features. Integration site dataset names are shown above the columns. Genomic features analyzed are shown to the left of the corresponding row of heatmap. The heatmap compares each experimental dataset to the matched random controls relative to frequency of the indicated genomic feature. A colored receiver operating characteristic (ROC) area scale is shown along the bottom of the panel with increasing shades of blue indicating negative correlation relative to the genomic feature and increasing shades of red indicating positive correlation relative to the comparison set. Comparisons to genomic features were carried out as previously described., Asterisks summarize the statistical significance of departures from random (*P < .05; **P < .01; ***P < .001).
Figure 3
Figure 3
Vector integration site preferences in individual mice reflects trends of combined mice analysis. Ratio of number of vector integrants divided by number of random insertions showing likelihood over random for vector integrants to be located within 50 kb of (A) RefSeq genes, (B) CpG islands, and (C) oncogenes.
Figure 4
Figure 4
No difference in magnitude of expression change in adjacent normal tissue and in tumor tissue for genes near tumor integrants and genes distal to tumor integrants. Plots of log2-transformed gene expression levels in tumor tissue versus log2-transformed gene expression levels in adjacent normal for mice (A) M24, (B) M48, (C) M50, and (D) M60. Gene expression levels were determined from microarray with the use of the Mouse Gene 1.0ST Affymetrix chip. Red dots indicate the closest gene to an integrant cloned from tumor tissue, and black dots indicate all other genes on the array. P value from the Mann-Whitney U test compared the change in expression for genes near integrants with all other genes.
Figure 5
Figure 5
Up-regulation of oncogenes near integrants cloned from tumor tissue occurs independently of vector integration. Expression analysis of up-regulated (A) mouse cancer-related genes and (B) mouse homologs of human cancer-related genes located within 100 kb of an AAV2-hFIX16 integrant cloned from tumor tissue. Expression ratio was obtained by dividing the absolute array signal from tumor tissue by the absolute array signal from adjacent normal tissue. Individual M24 and M50 Ntrk1 integrants were quantified by qPCR, performing 4 independent measurements on total DNA isolated from tumor tissue.

Comment in

  • Quest for safety at AAValon.
    Montini E. Montini E. Blood. 2011 Mar 24;117(12):3249-50. doi: 10.1182/blood-2011-02-321984. Blood. 2011. PMID: 21436076 No abstract available.

References

    1. Manno CS, Pierce GF, Arruda VR, et al. Successful transduction of liver in hemophilia by AAV-factor IX and limitations imposed by the host immune response. Nat Med. 2006;12(5):342–347. - PubMed
    1. Nakai H, Yant SR, Storm TA, Fuess S, Meuse L, Kay MA. Extrachromosomal recombinant adeno-associated virus vector genomes are primarily responsible for stable liver transduction in vivo. J Virol. 2001;75(15):6969–6976. - PMC - PubMed
    1. Rutledge EA, Russell DW. Adeno-associated virus vector integration junctions. J Virol. 1997;71(11):8429–8436. - PMC - PubMed
    1. Nakai H, Iwaki Y, Kay MA, Couto LB. Isolation of recombinant adeno-associated virus vector-cellular DNA junctions from mouse liver. J Virol. 1999;73(7):5438–5447. - PMC - PubMed
    1. Miller DG, Petek LM, Russell DW. Adeno-associated virus vectors integrate at chromosome breakage sites. Nat Genet. 2004;36(7):767–773. - PubMed

Publication types