. 2011 Feb 4;286(5):3815-28.
doi: 10.1074/jbc.M110.186981. Epub 2010 Nov 24.

Liver cytochrome P450 3A endoplasmic reticulum-associated degradation: a major role for the p97 AAA ATPase in cytochrome P450 3A extraction into the cytosol

Affiliations

Liver cytochrome P450 3A endoplasmic reticulum-associated degradation: a major role for the p97 AAA ATPase in cytochrome P450 3A extraction into the cytosol

Poulomi Acharya et al. J Biol Chem. .

Abstract

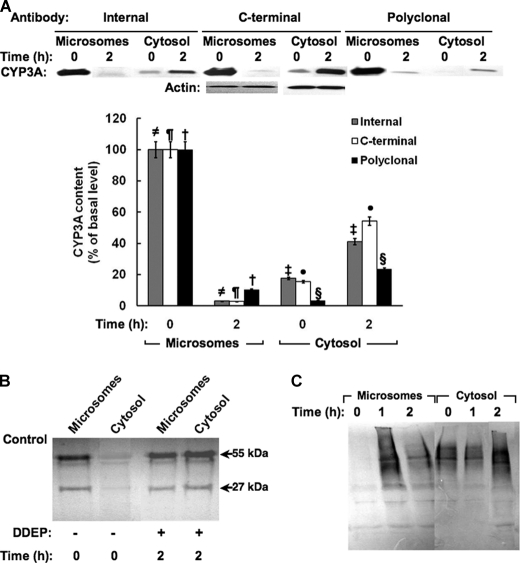
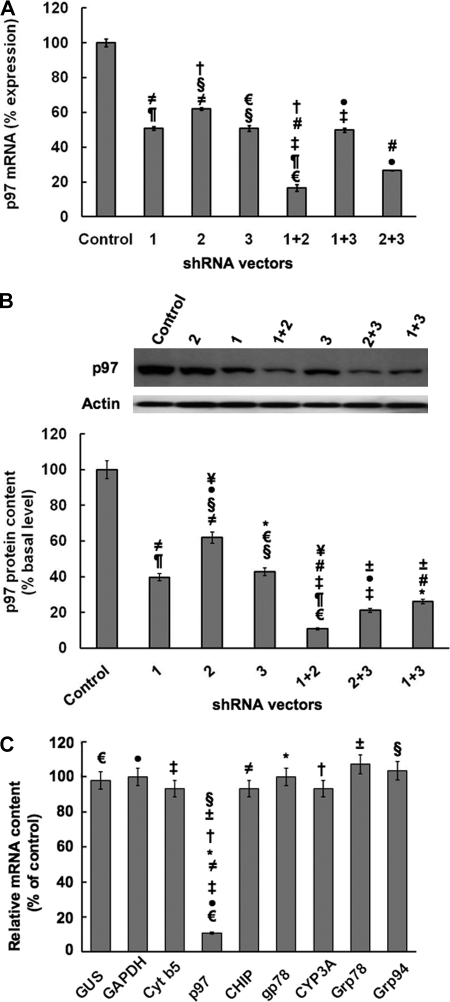
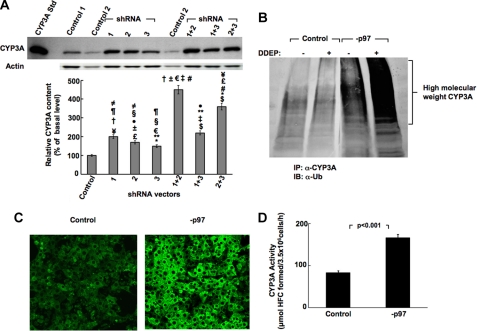
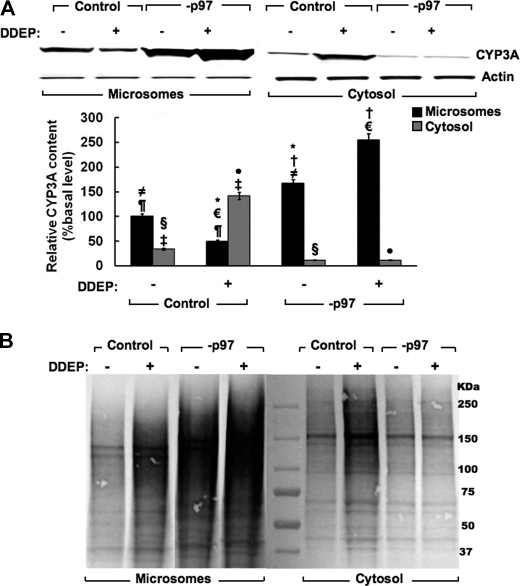
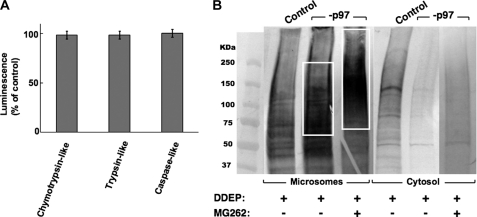
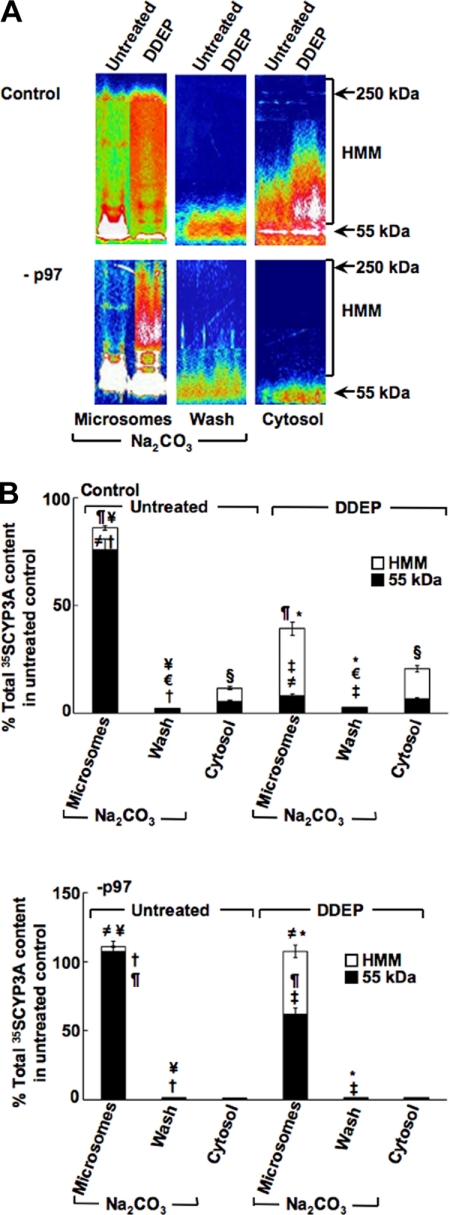
The CYP3A subfamily of hepatic cytochromes P450, being engaged in the metabolism and clearance of >50% of clinically relevant drugs, can significantly influence therapeutics and drug-drug interactions. Our characterization of CYP3A degradation has indicated that CYPs 3A incur ubiquitin-dependent proteasomal degradation (UPD) in an endoplasmic reticulum (ER)-associated degradation (ERAD) process. Cytochromes P450 are monotopic hemoproteins N-terminally anchored to the ER membrane with their protein bulk readily accessible to the cytosolic proteasome. Given this topology, it was unclear whether they would require the AAA-ATPase p97 chaperone complex that retrotranslocates/dislocates ubiquitinated ER-integral and luminal proteins into the cytosol for proteasomal delivery. To assess the in vivo relevance of this p97-CYP3A association, we used lentiviral shRNAs to silence p97 (80% mRNA and 90% protein knockdown relative to controls) in sandwich-cultured rat hepatocytes. This extensive hepatic p97 knockdown remarkably had no effect on cellular morphology, ER stress, and/or apoptosis, despite the well recognized strategic p97 roles in multiple important cellular processes. However, such hepatic p97 knockdown almost completely abrogated CYP3A extraction into the cytosol, resulting in a significant accumulation of parent and ubiquitinated CYP3A species that were firmly ER-tethered. Little detectable CYP3A accumulated in the cytosol, even after concomitant inhibition of proteasomal degradation, thereby documenting a major role of p97 in CYP3A extraction and delivery to the 26 S proteasome during its UPD/ERAD. Intriguingly, the accumulated parent CYP3A was functionally active, indicating that p97 can regulate physiological CYP3A content and thus influence its clinically relevant function.


Figures

FIGURE 1.
FIGURE 1.
Extraction of DDEP-inactivated CYP3A into cytosol. A, microsomes or cytosol from Dex-pretreated rats (n = 3) treated with DDEP for 0 or 2 h were subjected to immunoblotting analyses with polyclonal antibody against the proline-rich (Internal), C-terminal, or intact CYP3A23 domains as the primary antibody, and the CYP3A content was densitometrically quantified as described (see “Experimental Procedures”). Corresponding actin loading controls are also included. A representative CYP3A immunoblot obtained with each antibody is shown at the top, and the corresponding densitometric quantification of three individual immunoblots is shown at the bottom. Values are mean ± S.D. (error bars) of immunochemically detected CYP3A content in liver microsomes or cytosol from three individual rats, expressed as a percentage of their initial (0 h) values. Statistically significant differences in CYP3A content were observed between the two mean ± S.D. values, each marked with the same symbol as follows. , p < 0.0001; ¶, p < 0.0001; †, p < 0.0001; §, p < 0.005; ‡, p < 0.001; ●, p < 0.001. B, a typical CYP3A immunoblotting analysis with a goat polyclonal antibody against the intact protein is shown of CYP3A immunoaffinity-captured with an antibody against the extreme N terminus of the CYP3A23 signal anchor using the corresponding microsomes and cytosol shown in A. C, Ub-immunoblotting analyses of CYP3A immunoprecipitates from liver microsomes and cytosol obtained from rats treated with DDEP for 0, 1, or 2 h. A typical immunoblot developed with alkaline phosphatase-conjugated secondary antibody is shown.
FIGURE 2.
FIGURE 2.
RNAi-mediated p97 knockdown; Effects on p97 mRNA and protein expression in cultured rat hepatocytes and specificity of the p97 knockdown. A, effects of shRNA 1, shRNA 2, and shRNA 3 targeted against hepatic p97 individually or in combination or a control shRNA (Control) on hepatic p97 mRNA content derived from qRT-PCR analyses of total RNA isolated from each shRNA-infected cell culture. Values are mean ± S.D. (error bars) of three individually treated hepatocyte cultures. Statistically significant differences in hepatic p97 mRNA content were observed between the control values and values from shRNA 1+2- and shRNA 2+3-infected cells at p < 0.0001 and p < 0.0005, respectively, and all other shRNA-infected cells at p < 0.01. Similar statistically significant differences between the two mean ± S.D. values each marked with the same symbol were as follows. , p < 0.01; ¶, p < 0.001; †, p < 0.001; §, p < 0.01; €, p < 0.001; #, p < 0.01; ‡, p < 0.001; ●, p < 0.005. B, effects of p97 shRNAs individually or in combination on hepatic p97 protein. A representative example of p97 Western immunoblotting analyses of these hepatocyte lysates (50 μg of protein) is shown at the top, with corresponding aliquots used for actin immunoblotting analyses as loading controls. Densitometric quantification (mean ± S.D.) of hepatic p97 content from three individual experiments is shown at the bottom. Shown are statistically significant differences in hepatic p97 protein content (mean ± S.D.) between control shRNA-infected cells and those infected with shRNA 1 or shRNA 3 at p < 0.001, those infected with shRNA 2 at p < 0.005, those infected with shRNA 1+3 or shRNA 2+3 at p < 0.0005, and those infected with shRNA 1 + 2 at p < 0.0001. Statistically significant differences in hepatic p97 protein content were observed between the control values and values from shRNA 1+2-, shRNA 1+3-, and shRNA 2+3-infected cells at p < 0.0001, p < 0.0005, and p < 0.0005, respectively; shRNA 1- and shRNA 3-infected cells at p < 0.001; and shRNA 2-infected cells at p < 0.005. Similar statistically significant differences between the two mean ± S.D. values each marked with the same symbol were as follows. , p < 0.01; ¶, p < 0.005; ¥, p < 0.001; ±, p < 0.05; #, p < 0.01; §, p < 0.01; €, p < 0.005; *, p < 0.01; ‡, p < 0.01; ●, p < 0.002. C, evidence of the relative target specificity of p97 shRNA 1+2 against hepatic p97 mRNA by qRT-PCR analyses is documented. Statistically significant differences in hepatic p97 mRNA content were observed between the two mean ± S.D. values (n = 3 individual cultures), each marked with the same symbol as follows. , p < 0.0001; ±, p < 0.0001; †, p < 0.0001; §, p < 0.0001; €, p < 0.0001; *, p < 0.0001; ‡, p < 0.0001; ●, p < 0.0001.
FIGURE 3.
FIGURE 3.
Effects of RNAi-mediated p97 knockdown on hepatic CYP3A content. A, effects of shRNA 1, shRNA 2, and shRNA 3 targeted against hepatic p97 individually or in combination or a control shRNA (Control) on hepatic CYP3A content of cell lysates derived from such shRNA-infected cell cultures. Hepatocytes were infected with each shRNA individually or in combination and then treated with the CYP3A inducer Dex. Cells were harvested on the 8th day of knockdown. A representative example of CYP3A Western immunoblotting analyses of these hepatocyte lysates (50 μg of protein) is shown at the top, with corresponding aliquots used for actin immunoblotting analyses as loading controls. Densitometric quantification of hepatic CYP3A content from three individual experiments (mean ± S.D. (error bars)) is shown at the bottom. Statistical analyses revealed significant differences in hepatic CYP3A content (mean ± S.D.) between control shRNA-infected cells and cells infected with shRNA 1, shRNA 2, or shRNA 1+3 at p < 0.01; shRNA 3 at p < 0.05; shRNA 2+3 at p < 0.001; and shRNA 1+2 at p < 0.0001. Statistically significant differences in hepatic CYP3A protein content observed between the two mean ± S.D. values each marked with the same symbol were as follows. , p < 0.05; ¶, p < 0.01; †, p < 0.0002; ¥, p < 0.001; ±, p < 0.0001; #, p < 0.005; §, p < 0.05; €, p < 0.0001; **, p < 0.01; ‡, p < 0.0002; $, p < 0.001; #, p < 0.005; £, p < 0.001; *, p < 0.01; ●, p < 0.02. B, effects of p97 shRNA 1+2-mediated knockdown (−p97) on hepatic CYP3A ubiquitination monitored on the 8th day post-p97 knockdown relative to control shRNA-infected cells (Control). Some control and −p97 cells were treated with the CYP3A suicide inactivator DDEP for 4 h. CYP3A immunoprecipitates (IP) from lysates derived from DDEP-treated control and −p97 cells at 0 and 4 h were subjected to Ub-immunoblotting analyses (IB) as detailed (see “Experimental Procedures”). A representative immunoblot is shown. C, in situ verification of CYP3A stabilization in cultured rat hepatocytes with confocal immunofluorescence microscopy. Shown are rat hepatocyte cultures infected with the control shRNA (Control), or p97 shRNA 1+2 (−p97) for 7 days. On the 8th day, shRNA-infected rat hepatocyte cultures were fixed and stained with antibodies to CYP3A (green). Data from a representative experiment showing relative CYP3A accumulation are shown. D, functional relevance of hepatic CYP3A stabilization after p97 knockdown (−p97). Rat hepatocyte cultures were infected with the control shRNA or p97 shRNA 1+2 (−p97) for 7 days. On the 8th day, CYP3A functional activity was assayed in intact hepatocytes by assessing their ability to catalyze the 7-O-debenzylation of BFC, a diagnostic CYP3A functional probe, to HFC. The relative HFC formation (μmol of HFC formed/3.5 × 106 cells/h) in the medium was assayed (as detailed under “Experimental Procedures”). Experimental values (mean ± S.D.) from three individual experiments are shown. Statistical analyses revealed significant differences in hepatic CYP3A function between control and −p97 cells at p < 0.01.
FIGURE 4.
FIGURE 4.
Effects of hepatic p97 knockdown on CYP3A extraction from the ER into the cytosol. A, cells were infected with control shRNA or p97 shRNA 1+2 (−p97) for 7 days. On the 8th day, cells were treated with DDEP (100 μm; +) or equivalent volume of the vehicle (DMSO; −) for 4 h. Cells were harvested, and microsomes (5 μg of protein) and cytosol (10 μg) derived from cell homogenates were subjected to CYP3A immunoblotting analyses as described (see “Experimental Procedures”). A representative CYP3A immunoblot is shown at the top, and the corresponding densitometric quantification of three individual immunoblots is shown at the bottom. Values are mean ± S.D. (error bars) of immunochemically detected CYP3A content in liver microsomes or cytosol from three individual cell cultures, expressed as a percentage of their corresponding vehicle-treated basal (−DDEP) values. Statistically significant differences in hepatic CYP3A protein content observed between the two mean ± S.D. values each marked with the same symbol were as follows. , p < 0.001; ¶, p < 0.002; †, p < 0.001; ¥, p < 0.001; §, p < 0.01; €, p < 0.0001; ‡, p < 0.001; *, p < 0.001; ●, p < 0.0005. B, corresponding effects of p97 shRNA 1+2-mediated knockdown (−p97) on hepatic CYP3A ubiquitination are shown. Some control and −p97 cells were treated with the CYP3A suicide inactivator DDEP for 4 h. CYP3A immunoprecipitates from microsomes and cytosol derived from DDEP-treated control and −p97 cells at 0 and 4 h were subjected to Ub-immunoblotting analyses as detailed (see “Experimental Procedures”). A representative immunoblot is shown.
FIGURE 5.
FIGURE 5.
Relative contribution of p97 versus the 26 S proteasome to the extraction of ubiquitinated CYP3A from the ER. A, assessment of the effects of p97 knockdown on hepatic proteasomal function. Cells were infected with control shRNA or p97 shRNA 1+2 (−p97) for 7 days, and on the 8th day they were examined with the specific probes for the proteasomal chymotrypsin-like, trypsin-like, and caspase-like activities in a cell-based bioluminescent assay as detailed (see “Experimental Procedures”). Values are mean ± S.D. (error bars) relative luminescence units derived from three separate −p97 cultures and expressed as a percentage of the values for corresponding activities in control shRNA-treated cells. No statistically significant differences were observed between activities from control and −p97 cells. B, cells were infected with control shRNA or p97 shRNA 1+2 (−p97) for 7 days and then on the 8th day treated with or without DDEP for 4 h as described in the legend to Fig. 4. Some DDEP-treated cells were also treated concomitantly with the proteasomal inhibitor, MG262. Microsomes or cytosol were isolated and subjected to CYP3A immunoprecipitation. The corresponding CYP3A immunoprecipitates from microsomes or cytosol were subjected to Ub-immunoblotting analyses and development with alkaline phosphatase-conjugated secondary antibody as detailed (see “Experimental Procedures”). A representative immunoblot is shown.
FIGURE 6.
FIGURE 6.
Relative intracellular localization of parent and ubiquitinated HMM CYP3A species after p97 knockdown in cultured hepatocytes. Rat hepatocyte cultures were infected with control shRNA or p97 shRNA 1+2 (−p97) for 7 days. On the 8th day, they were subjected to 35S-pulse-chase analyses. Two h after cold chase, some cells were treated with or without DDEP for 4 h as described in the legend to Fig. 4. Cells were harvested, and homogenates were subfractionated into cytosol and microsomes. CYP3A immunoprecipitates (45 μl) from cytosol (Cytosol), Na2CO3-washed microsomes (Microsomes), and wash corresponding to the Na2CO3-solubilized material (Wash) were obtained as described under “Experimental Procedures” and subjected to SDS-PAGE analyses. The gels were dried and then exposed to PhosphorImager screens and visualized using a Typhoon scanner. A, a typical SDS-PAGE gel is shown as a representative of corresponding CYP3A immunoprecipitates from pooled hepatocyte cultures. The color wheel intensity code is as follows: white > magenta > red > orange > yellow > green > light blue > dark blue > black. B, the corresponding relative [35S]CYP3A intensity of the parent CYP3A (55–60 kDa), Na2CO3-solubilized (dislocated), and the HMM ubiquitinated CYP3A species between 65 and 250 kDa in each lane were quantified using ImageQuant software. Values are mean ± S.D. (error bars) of three individual determinations and are expressed as a percentage of the total (parent, HMM, and dislocated) [35S]CYP3A protein content in untreated control cells. Statistically significant differences in hepatic CYP3A protein content observed between the two mean ± S.D. values each marked with the same symbol were as follows. Top, , p < 0.0005; ¶, p < 0.001; †, p < 0.0001; ¥, p < 0.001; ‡, p < 0.01; §, p < 0.01; *, p < 0.0005; €, not significant. Bottom, ≠, p < 0.0005; ¶, p < 0.005; †, p < 0.0001; *, p < 0.0001; ‡, p < 0.0005; ¥, not significant.

Similar articles

Cited by

References

    1. Guengerich F. P. (2005) Cytochrome P450: Structure, Mechanism and Biochemistry (Ortiz de Montellano P. ed) pp. 377–530, Kluwer-Academic/Plenum Press, New York
    1. Sakaguchi M., Mihara K., Sato R. (1984) Proc. Natl. Acad. Sci. U.S.A. 81, 3361–3364 - PMC - PubMed
    1. De Lemos-Chiarandini C., Frey A. B., Sabatini D. D., Kreibich G. (1987) J. Cell Biol. 104, 209–219 - PMC - PubMed
    1. Vergères G., Winterhalter K. H., Richter C. (1989) Biochemistry 28, 3650–3655 - PubMed
    1. Brown C. A., Black S. D. (1989) J. Biol. Chem. 264, 4442–4449 - PubMed