. 2011 Mar;54(3):605-16.
doi: 10.1007/s00125-010-1973-8. Epub 2010 Nov 24.

Dissociation of lipotoxicity and glucotoxicity in a mouse model of obesity associated diabetes: role of forkhead box O1 (FOXO1) in glucose-induced beta cell failure

Affiliations

Dissociation of lipotoxicity and glucotoxicity in a mouse model of obesity associated diabetes: role of forkhead box O1 (FOXO1) in glucose-induced beta cell failure

O Kluth et al. Diabetologia. 2011 Mar.

Abstract

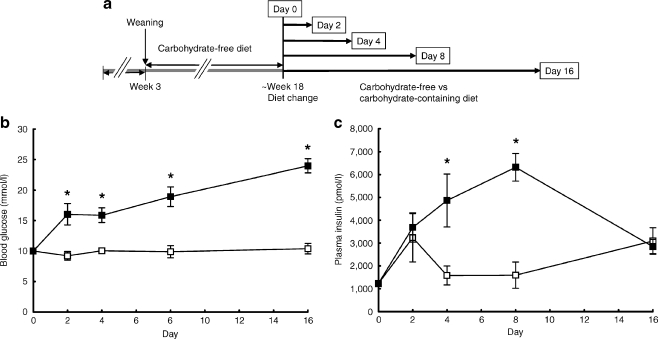
Aims/hypothesis: Carbohydrate-free diet prevents hyperglycaemia and beta cell destruction in the New Zealand Obese (NZO) mouse model. Here we have used a sequential dietary regimen to dissociate the effects of obesity and hyperglycaemia on beta cell function and integrity, and to study glucose-induced alterations of key transcription factors over 16 days.

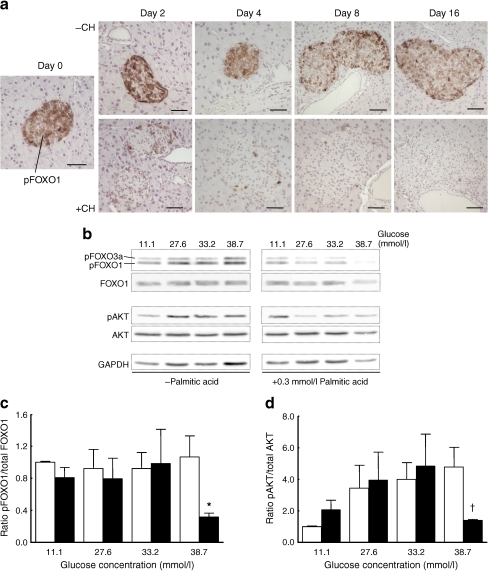
Methods: Mice were rendered obese by feeding a carbohydrate-free diet for 18 weeks. Thereafter, a carbohydrate-containing diet was given. Plasma glucose, plasma insulin and total pancreatic insulin were determined, and forkhead box O1 protein (FOXO1) phosphorylation and the transcription factors pancreatic and duodenal homeobox 1 (PDX1), NK6 homeobox 1 protein (NKX6.1) and v-maf musculoaponeurotic fibrosarcoma oncogene family, protein A (avian) (MAFA) were monitored by immunohistochemistry for 16 days.

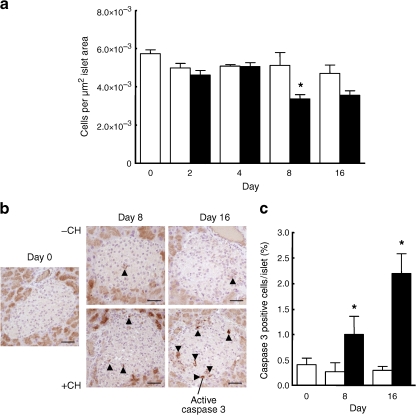
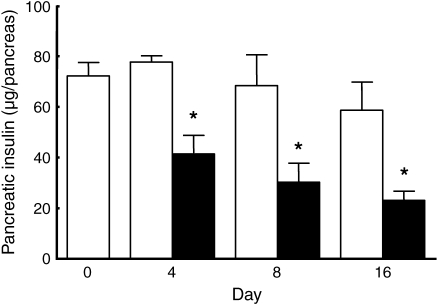
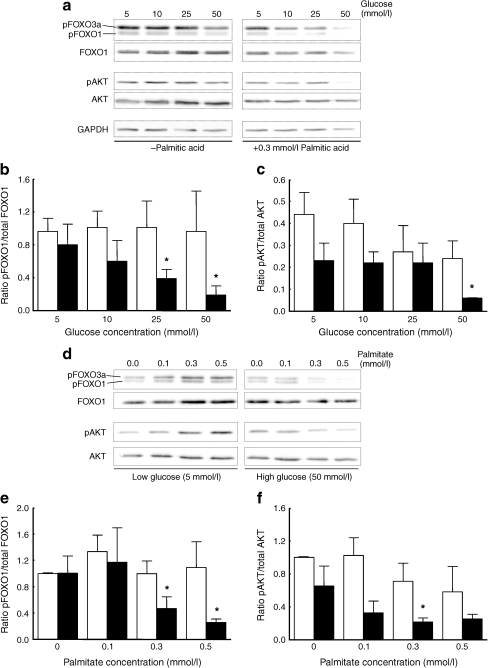
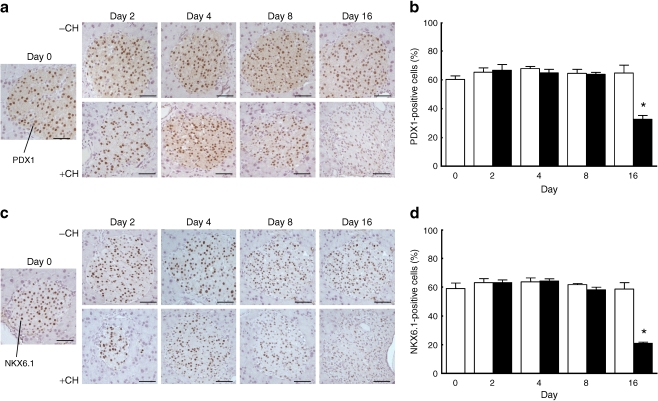
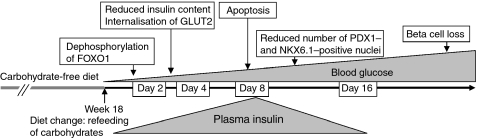
Results: Dietary carbohydrates produced a rapid and continuous increase in plasma glucose in NZO mice between day 2 and 16 after the dietary challenge. Hyperglycaemia caused a dramatic dephosphorylation of FOXO1 at day 2, followed by a progressive depletion of insulin stores. The loss of beta cells was triggered by apoptosis (detectable at day 8), associated with reduction of crucial transcription factors (PDX1, NKX6.1 and MAFA). Incubation of isolated islets from carbohydrate-restricted NZO mice or MIN6 cells with palmitate and glucose for 48 h resulted in a dephosphorylation of FOXO1 and thymoma viral proto-oncogene 1 (AKT) without changing the protein levels of both proteins.

Conclusions/interpretation: The dietary regimen dissociates the effects of obesity (lipotoxicity) from those of hyperglycaemia (glucotoxicity) in NZO mice. Obese NZO mice are unable to compensate for the carbohydrate challenge by increasing insulin secretion or synthesising adequate amounts of insulin. In response to the hyperglycaemia, FOXO1 is dephosphorylated, leading to reduced levels of beta cell-specific transcription factors and to apoptosis of the cells.


Figures

Fig. 1
Fig. 1
Carbohydrate refeeding causes rapid onset of hyperglycaemia and delayed decompensation of insulin secretion in NZO mice. a Study design for the application of carbohydrate-restricted (−CH) and carbohydrate-containing diets (+CH). Until week 18, obesity and insulin resistance was produced by application of a carbohydrate-free diet. Thereafter, a high-carbohydrate (white squares) or a carbohydrate-free diet (black squares) was given for 16 days. b, c Time course of (b) blood glucose and (c) plasma insulin after the diet change. Samples were collected at the indicated time points, and data represent mean±SEM of at least ten mice
Fig. 2
Fig. 2
Immunohistochemistry of insulin, glucagon and proinsulin in pancreatic sections of NZO mice after a diet change from a carbohydrate-free (−CH) to a carbohydrate-containing diet (+CH). Sections from pancreas embedded in paraffin were haematoxylin-stained and immunostained with the respective antisera and developed with DAB as described in the Methods. Scale bars, 50 μm
Fig. 3
Fig. 3
Reduction of the number of insulin-positive cells. a Morphometric determination of the relative number of cells per μm2 islet area after the diet change from a carbohydrate-free (white bars) to a carbohydrate-containing (black bars) diet. From each mouse, 35 islets in one to six pancreatic sections were evaluated in a blinded procedure. b Immunostaining of activated caspase-3 in islets of NZO mice treated with (+CH) or without (−CH) carbohydrates for 8 and 16 days. c Quantification of caspase-3-positive cells from NZO mice fed the indicated diets. Data represent mean±SEM of three to six mice, calculated from the mean values of the individual mice. *p < 0.05 for –CH vs +CH at the indicated time point
Fig. 4
Fig. 4
Carbohydrate-containing diet causes decrease of pancreatic insulin in NZO mice. A carbohydrate-free diet was given until week 18 in order to produce obesity and insulin resistance. Thereafter, a carbohydrate-containing (black bars) or a carbohydrate-free diet (white bars) was given for 16 days. Whole pancreas was dissected at the indicated time points, and insulin was extracted and determined as described in the Methods. Data represent mean±SEM of six mice; *p < 0.05 for carbohydrate-containing vs carbohydrate-free diet
Fig. 5
Fig. 5
Reduced levels of pFOXO1 after carbohydrate intervention. a Immunohistochemistry of pFOXO1 in pancreatic sections of NZO mice after a diet change from a carbohydrate-free (−CH) to a carbohydrate-containing diet (+CH). Sections embedded in paraffin at the indicated day were stained with haematoxylin and anti-pFOXO1 and subsequently developed with DAB as described in Methods. Bars: 50 μm. b Western blot analysis of lysates of isolated islets from carbohydrate-free fed NZO mice after in vitro incubation with the indicated glucose concentrations in the absence or presence of 0.3 mmol/l palmitate. c, d Quantification of western blot products of lysates from three independent experiments as shown in b. c Ratio of pFOXO1/total FOXO1 and d ratio of pAKT/total AKT. Values represent mean±SEM; *p ≤ 0.05, p = 0.06 for absence (white bars) vs presence (black bars) of 0.3 mmol/l palmitate at the indicated glucose concentration
Fig. 6
Fig. 6
Reduced levels of pFOXO1 and pAKT in MIN6 cells in response to glucose and palmitate exposure. a Western blot analyses of lysates from MIN6 cells incubated with the indicated glucose concentrations in the absence or presence of 0.3 mmol/l palmitate for 48 h were performed with the indicated antibodies as described in Methods. b, c Quantification of western blot products of lysates from three independent experiments as shown in a: pFOXO1/total FOXO1 (b) and ratio of pAKT/total AKT (c). *p ≤ 0.05 for absence (white bars) vs presence (black bars) of palmitate at the indicated glucose concentration. d Western blot analysis of lysates from MIN6 cells incubated with the indicated palmitate concentrations in the absence or presence of 50 mmol/l glucose for 48 h. e, f Quantification of western blot products of lysates from three independent experiments as shown in d: Ratio of pFOXO1/total FOXO1 (e) and ratio of pAKT/total AKT (f). Values represent mean±SEM; *p ≤ 0.05 for low glucose (white bars) vs high glucose (black bars) at the indicated palmitate concentration
Fig. 7
Fig. 7
Immunohistochemistry and quantification of PDX1 (a, b) and NKX6.1 (c, d) in pancreatic sections of NZO mice after a diet change from carbohydrate-free (−CH) (white bars) to carbohydrate-containing diet (+CH) (black bars). (a, c) Sections embedded in paraffin at the indicated day were haematoxylin-stained and immunostained with the respective antiserum and developed with DAB as described in Methods. Scale bars, 50 μm. (b, d) Quantifications of nuclei positive for PDX1 (b) and NKX6.1 (d) were performed for three to six mice per group; *p ≤ 0.05 for –CH vs +CH at the indicated time points
Fig. 8
Fig. 8
Schematic presentation of the time course of events leading to beta cell loss in NZO mice after carbohydrate refeeding

References

    1. Herberg L, Coleman DL. Laboratory animals exhibiting obesity and diabetes syndromes. Metabolism. 1977;26:59–98. doi: 10.1016/0026-0495(77)90128-7. - DOI - PubMed
    1. Herberg L, Leiter EH. Obesity/diabetes in mice with mutations in the leptin or leptin receptor genes. In: Sima AAF, Shafrir E, editors. Frontiers in animal diabetes research, vol. 2: animal models of diabetes. Amsterdam: Harwood Academic Publishers; 2001. pp. 63–107.
    1. Ortlepp JR, Kluge R, Giesen K, et al. A metabolic syndrome of hypertension, hyperinsulinemia, and hypercholesterolemia in the New Zealand obese (NZO) mouse. Eur J Clin Investig. 2000;30:195–202. doi: 10.1046/j.1365-2362.2000.00611.x. - DOI - PubMed
    1. Leiter EH, Reifsnyder PC, Flurkey K, Partke HJ, Junger E, Herberg L. NIDDM genes in mice. Deleterious synergism by both parental genomes contributes to diabetic thresholds. Diabetes. 1998;47:1287–1295. doi: 10.2337/diabetes.47.8.1287. - DOI - PubMed
    1. Plum L, Kluge R, Giesen K, Altmüller J, Ortlepp JR, Joost HG. Type-2-diabetes-like hyperglycaemia in a backcross model of New Zealand obese (NZO) and SJL mice: characterization of a susceptibility locus on chromosome 4 and its relation with obesity. Diabetes. 2000;49:1590–1596. doi: 10.2337/diabetes.49.9.1590. - DOI - PubMed

Publication types

MeSH terms