. 2010 Dec;40(12):3426-38.
doi: 10.1002/eji.201040440. Epub 2010 Nov 11.

Robust genital gag-specific CD8+ T-cell responses in mice upon intramuscular immunization with simian adenoviral vectors expressing HIV-1-gag

Affiliations

Robust genital gag-specific CD8+ T-cell responses in mice upon intramuscular immunization with simian adenoviral vectors expressing HIV-1-gag

Larissa H Haut et al. Eur J Immunol. 2010 Dec.

Abstract

Most studies on E1-deleted adenovirus (Ad) vectors as vaccine carriers for antigens of HIV-1 have focused on induction of central immune responses, although stimulation of mucosal immunity at the genital tract (GT), the primary port of entry of HIV-1, would also be highly desirable. In this study, different immunization protocols using chimpanzee-derived adenoviral (AdC) vectors expressing Gag of HIV-1 clade B given in heterologous prime-boost regimens were tested for induction of systemic and genital immune responses. Although i.n. immunization stimulated CD8(+) T-cell responses that could be detected in the GT, this route induced only marginal cellular responses in systemic tissues and furthermore numbers of Gag-specific CD8(+) T cells contracted sharply within a few weeks. On the contrary, i.m. immunization induced higher and more sustained frequencies of vaccine-induced cells which could be detected in the GT as well as systemic compartments. Antigen-specific CD8(+) T cells could be detected 1 year after immunization in all compartments analyzed. Genital memory cells secreted IFN-γ, expressed high levels of CD103 and their phenotypes were consistent with a state of activation. Taken together, the results presented here show that i.m. vaccination with chimpanzee-derived (simian) adenovirus vectors is a suitable strategy to induce a long-lived genital CD8(+) T-cell response.


Conflict of interest statement

Conflict of Interest The authors disclose there are no conflicts of interest.

Figures

Figure 1
Figure 1
Frequencies of gag-specific CD8+ T-cells after administration of AdC vectors expressing HIV-1 gag. (A) Mice were immunized i.n. (open bars), i.m. (black bars) or i.vag (striped bars) with AdC6gag. Cells from different tissues were analyzed at different time points thereafter, as indicated. Cells were stained with antibodies to CD8a, CD44 and specific tetramer and analyzed by flow cytometry. Graphs show frequencies of CD8+, tetramer+ cells over total CD8+ cells. The wk 0 data show the average frequencies in naïve mice obtained for the different time points. (B) Mice were immunized i.vag., i.n. or i.m. with the AdC6gag vector, and boosted 6 weeks later with the AdC68gag vector. I.n. primed mice were boosted i.n. (open bars) or i.vag. (angle-striped bars); i.vag. primed mice were boosted i.vag. (horizontally striped bars) or i.n. (vertically striped bars); i.m. primed mice were boosted i.vag (gray bars) or i.m. (black bars). Cells from different tissues were analyzed in A and B, 2 weeks before the boost (-2 wk), 2 and 4 weeks post-boost, and for the i.m./i.m. regimen 1 year after the boost. Samples from ILN, GT and NALT were pooled from 5-20 mice, samples from spleen and blood were analyzed from 5 individual mice. Statistical analysis was performed using unpaired two-sample Student’s t-test with p<0.01 (**) and p<0.05 (*). Columns show mean and +/- standard deviations upon comparison of 3 experiments conducted independently with groups of 20 mice for analysis of the GT and groups of 5 mice for the remaining tissues.
Figure 1
Figure 1
Frequencies of gag-specific CD8+ T-cells after administration of AdC vectors expressing HIV-1 gag. (A) Mice were immunized i.n. (open bars), i.m. (black bars) or i.vag (striped bars) with AdC6gag. Cells from different tissues were analyzed at different time points thereafter, as indicated. Cells were stained with antibodies to CD8a, CD44 and specific tetramer and analyzed by flow cytometry. Graphs show frequencies of CD8+, tetramer+ cells over total CD8+ cells. The wk 0 data show the average frequencies in naïve mice obtained for the different time points. (B) Mice were immunized i.vag., i.n. or i.m. with the AdC6gag vector, and boosted 6 weeks later with the AdC68gag vector. I.n. primed mice were boosted i.n. (open bars) or i.vag. (angle-striped bars); i.vag. primed mice were boosted i.vag. (horizontally striped bars) or i.n. (vertically striped bars); i.m. primed mice were boosted i.vag (gray bars) or i.m. (black bars). Cells from different tissues were analyzed in A and B, 2 weeks before the boost (-2 wk), 2 and 4 weeks post-boost, and for the i.m./i.m. regimen 1 year after the boost. Samples from ILN, GT and NALT were pooled from 5-20 mice, samples from spleen and blood were analyzed from 5 individual mice. Statistical analysis was performed using unpaired two-sample Student’s t-test with p<0.01 (**) and p<0.05 (*). Columns show mean and +/- standard deviations upon comparison of 3 experiments conducted independently with groups of 20 mice for analysis of the GT and groups of 5 mice for the remaining tissues.
Figure 2
Figure 2
IFN-γ production by vaccine-induced gag-specific CD8+ T-cells. IFN-γ ELISpot assay was performed with splenocytes from (A) mice immunized i.m. with AdC6gag 2 weeks earlier, and stimulated with the total pool of consensus gag clade B in paralel to the AMQMLKETI peptide or (B) mice immunized i.n. or i.m. with the AdC6gag vector and tested two weeks later. Each sample was tested in triplicate using the AMQMLKETI peptide as well as media controls for in vitro stimulation. Cells were also tested by flow cytometry to determine frequencies of CD8+ T-cells and results were normalized to reflect spots per 106 CD8+ cells. Data obtained with the control, which yielded <12 SFU for any of the samples, were subtracted from data obtained with the peptide. Statistical analysis was performed using unpaired two-sample Student’s t-test with p<0.01 (**) and p<0.05 (*) and columns show mean and +/- standard deviations upon comparison of results from 3 experiments conducted independently with groups of 10 mice for analysis of the GT and groups of 5 mice for the remaining tissues.
Figure 3
Figure 3
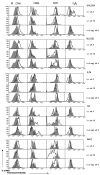
Phenotype analysis of gag-specific CD8+ T-cells upon mucosal or systemic administration of AdC vectors. Lymphocytes from different tissues were harvested, stained with antibodies to CD8, CD44, CD62L, CD27 and α4β7, and analyzed by flow cytometry. (A) Markers expression in mice that were vaccinated 4 or 10 weeks earlier with AdC6gag given i.n., or that were primed i.n. with AdC6gag and boosted 4 weeks before the analysis with AdC68gag given i.vag. (B) Markers expression in mice that were vaccinated 4 or 10 weeks earlier with AdC6gag given i.m., or that were primed i.m. with AdC6gag and then boosted with AdC68gag given i.m or i.vag. 4 weeks before the analysis. For i.m./i.m. immunized mice, analyses were also performed 1 year after the booster immunization. Both graphs show expression of the markers on tet+CD8+ from vaccinated mice (black lines) and tet-CD8+ cells from naïve mice (gray areas). The results are representative of 3 experiments conducted independently with groups of 20 mice for analysis of the GT and groups of 5 mice for the remaining tissues.
Figure 3
Figure 3
Phenotype analysis of gag-specific CD8+ T-cells upon mucosal or systemic administration of AdC vectors. Lymphocytes from different tissues were harvested, stained with antibodies to CD8, CD44, CD62L, CD27 and α4β7, and analyzed by flow cytometry. (A) Markers expression in mice that were vaccinated 4 or 10 weeks earlier with AdC6gag given i.n., or that were primed i.n. with AdC6gag and boosted 4 weeks before the analysis with AdC68gag given i.vag. (B) Markers expression in mice that were vaccinated 4 or 10 weeks earlier with AdC6gag given i.m., or that were primed i.m. with AdC6gag and then boosted with AdC68gag given i.m or i.vag. 4 weeks before the analysis. For i.m./i.m. immunized mice, analyses were also performed 1 year after the booster immunization. Both graphs show expression of the markers on tet+CD8+ from vaccinated mice (black lines) and tet-CD8+ cells from naïve mice (gray areas). The results are representative of 3 experiments conducted independently with groups of 20 mice for analysis of the GT and groups of 5 mice for the remaining tissues.
Figure 4
Figure 4
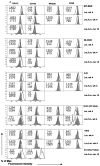
Phenotype of gag-specific CD8+-T cells induced by i.m. administration of AdC vectors. Lymphocytes from different tissues were harvested and analyzed 4 weeks after i.m. prime with AdC6gag vector, and 4 weeks and 1 year after boost with the heterologous AdC68gag vector. Lymphocytes were stained with antibodies to CD8, CD44, the tetramer and the markers indicated in the graphs, and analyzed by flow cytometry. (A) Expression of CD127, CD103, NKG2D and CD69. (B) Expression of lytic enzymes, CTLA-4, Ki-67 and PD-1. For analysis of gag-specific responses, cells were gated on CD8+, tetramer+ cells (black lines) and compared to tet-CD8+ cells from naïve mice (gray areas). Upper values show MFI for tetramer-CD8+ cells from naïve mice, lower values show MFI for tetramer+CD8+ cells from vaccinated animals. The results are representative of 3 experiments conducted independently with groups of 20 mice for analysis of the GT and groups of 5 mice for the remaining tissues.
Figure 4
Figure 4
Phenotype of gag-specific CD8+-T cells induced by i.m. administration of AdC vectors. Lymphocytes from different tissues were harvested and analyzed 4 weeks after i.m. prime with AdC6gag vector, and 4 weeks and 1 year after boost with the heterologous AdC68gag vector. Lymphocytes were stained with antibodies to CD8, CD44, the tetramer and the markers indicated in the graphs, and analyzed by flow cytometry. (A) Expression of CD127, CD103, NKG2D and CD69. (B) Expression of lytic enzymes, CTLA-4, Ki-67 and PD-1. For analysis of gag-specific responses, cells were gated on CD8+, tetramer+ cells (black lines) and compared to tet-CD8+ cells from naïve mice (gray areas). Upper values show MFI for tetramer-CD8+ cells from naïve mice, lower values show MFI for tetramer+CD8+ cells from vaccinated animals. The results are representative of 3 experiments conducted independently with groups of 20 mice for analysis of the GT and groups of 5 mice for the remaining tissues.
Figure 5
Figure 5
Migratory properties of adoptively transferred CD8+ T-cells. BALB/c mice were vaccinated with AdC6gag and boosted with AdC68gag. Fourteen days after the boost, splenocytes were isolated and transferred into naïve Thy1.1 recipient mice. Mice were euthanized 7 days later and samples were analyzed. Frequencies of gag-specific CD8+ T-cells in the transferred splenocyte population and at day 7 after transfer in the different compartments of the recipient mice are shown. Cells were stained with antibodies to CD8a, CD44, CD90.1 and the tetramer. For analysis of gag-specific responses, cells were gated on CD8+, CD90.1-, tetramer+ cells. The results are representative of 2 experiments conducted independently with groups of 10 mice. Statistical analysis was performed using unpaired two-sample Student’s t-test with p<0.01 (**).

Similar articles

Cited by

References

    1. Pikora CA. Glycosylation of the ENV spike of primate immunodeficiency viruses and antibody neutralization. Curr HIV Res. 2004;2:243–254. - PubMed
    1. Simmonds P, Balfe P, Ludlam CA, Bishop JO, Brown AJ. Analysis of sequence diversity in hypervariable regions of the external glycoprotein of human immunodeficiency virus type 1. J Virol. 1990;64:5840–5850. - PMC - PubMed
    1. Jones PL, Korte T, Blumenthal R. Conformational changes in cell surface HIV-1 envelope glycoproteins are triggered by cooperation between cell surface CD4 and co-receptors. J Biol Chem. 1998;273:404–409. - PubMed
    1. McMichael AJ. HIV vaccines. Annu Rev Immunol. 2006;24:227–255. - PubMed
    1. Chan DJ. Fatal attraction: sex, sexually transmitted infections and HIV-1. Int J STD AIDS. 2006;17:643–651. - PubMed

Publication types

MeSH terms

Substances