. 2010 Nov 25:7:35.
doi: 10.1186/1743-8977-7-35.

Inhalation exposure to nanosized and fine TiO2 particles inhibits features of allergic asthma in a murine model

Affiliations

Inhalation exposure to nanosized and fine TiO2 particles inhibits features of allergic asthma in a murine model

Elina M Rossi et al. Part Fibre Toxicol. .

Abstract

Background: Nanotechnology and engineered nanomaterials (ENM) are here to stay. Recent evidence suggests that exposure to environmental particulate matter exacerbates symptoms of asthma. In the present study we investigated the modulatory effects of titanium dioxide particle exposure in an experimental allergic asthma.

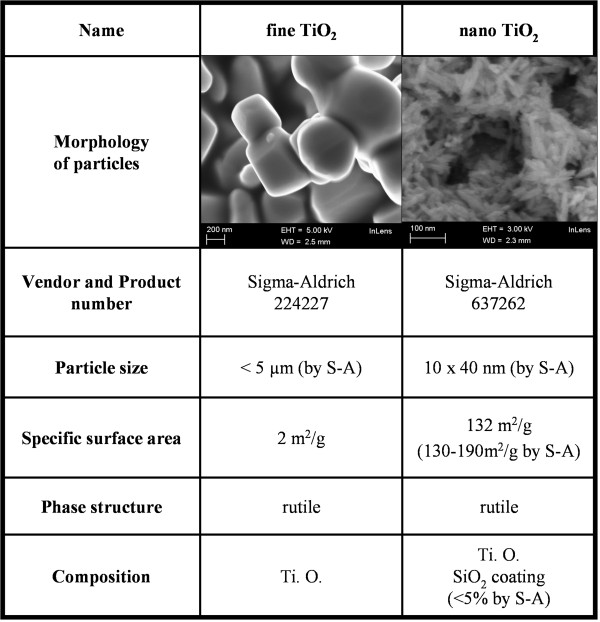
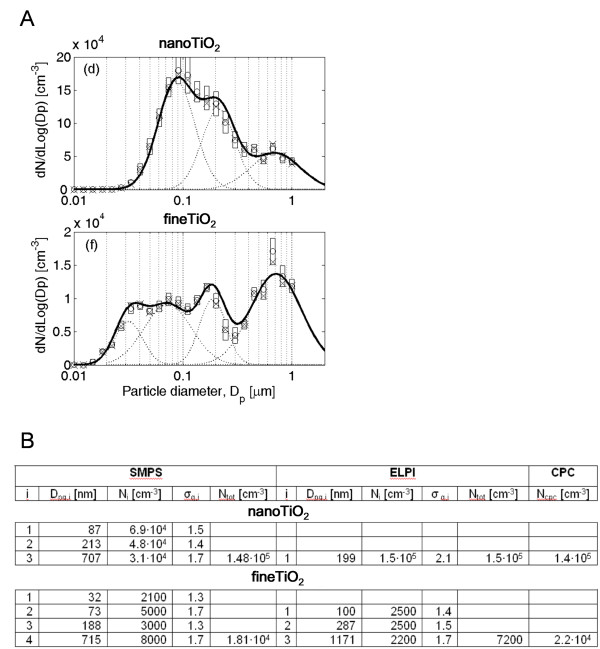
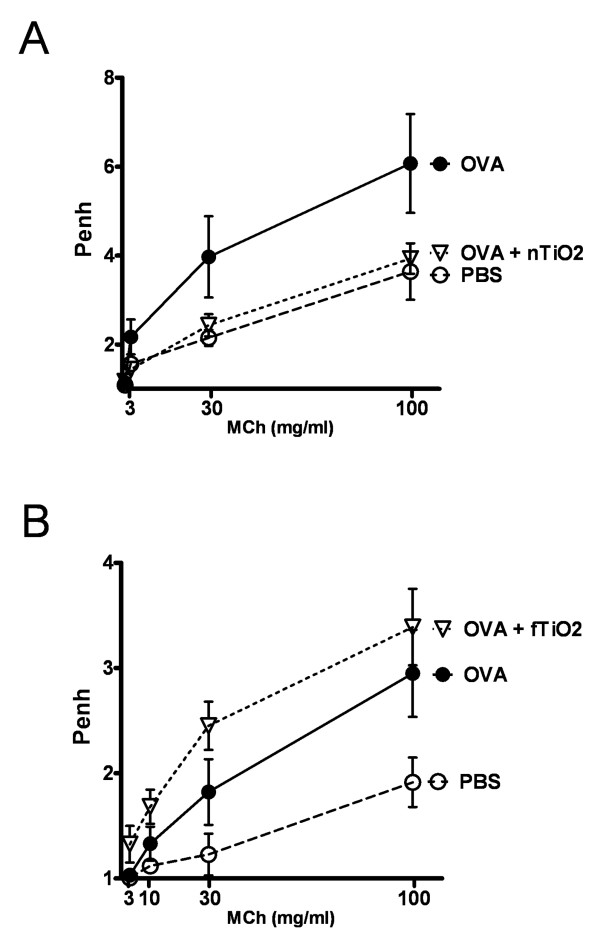
Methods: Nonallergic (healthy) and ovalbumin-sensitized (asthmatic) mice were exposed via inhalation to two different sizes of titanium dioxide particles, nanosized (nTiO2) and fine (fTiO2), for 2 hours a day, three days a week, for four weeks at a concentration of 10 mg/m3. Different endpoints were analysed to evaluate the immunological status of the mice.

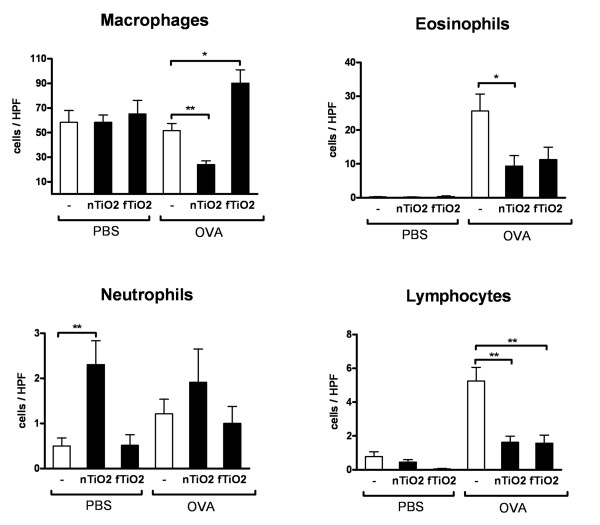
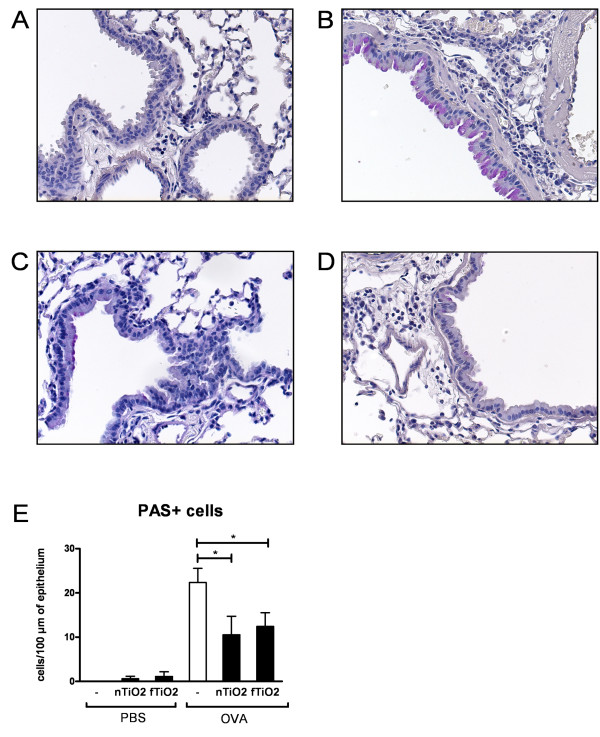
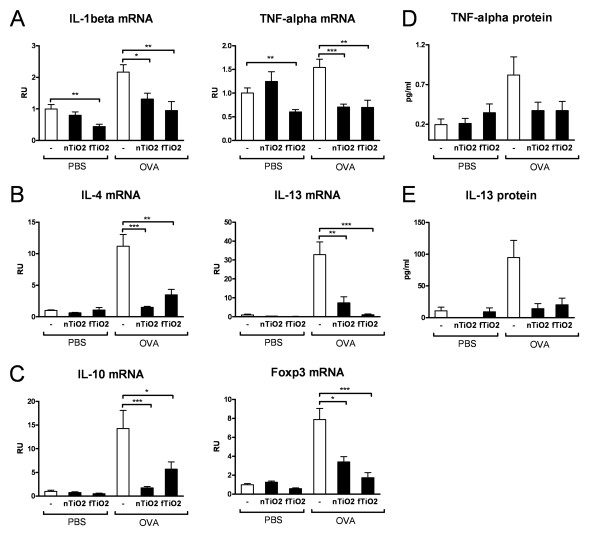
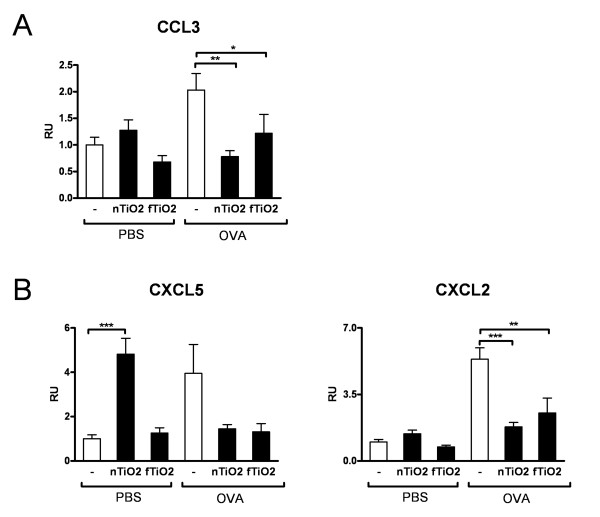
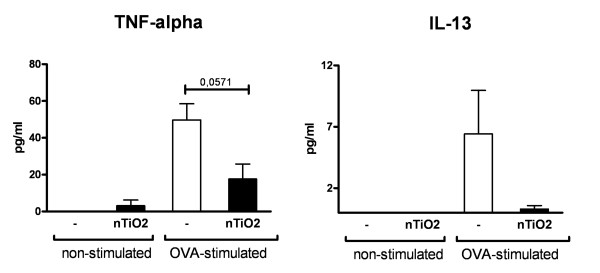
Results: Healthy mice elicited pulmonary neutrophilia accompanied by significantly increased chemokine CXCL5 expression when exposed to nTiO2. Surprisingly, allergic pulmonary inflammation was dramatically suppressed in asthmatic mice which were exposed to nTiO2 or fTiO2 particles - i.e. the levels of leucocytes, cytokines, chemokines and antibodies characteristic to allergic asthma were substantially decreased.

Conclusions: Our results suggest that repeated airway exposure to TiO2 particles modulates the airway inflammation depending on the immunological status of the exposed mice.


Figures

Figure 1
Figure 1
Particle characteristics. Particles used in this study are listed in this table. All characteristics are measured by us as described in the materials and methods section unless stated otherwise in the table. Pictures of nanoparticles are taken using scanning electron microscopy[9].
Figure 2
Figure 2
Particle and aerosol characteristics. A) Particle mobility and aerodynamic number size distributions measured with SMPS. Size bin concentrations are represented as mean (o), median (x) and standard deviation (box). Solid line represents mean of multi log-normal function and dotted lines are means of single modes. Measurements and fitting were done during steady-state condition. B) Multi log-normal fit parameters for Fig 2A. particle size distributions and mean particle concentration measured by CPC [32]. Dpg, i, Ni and σg, i are geometric mean diameter, particle concentration and geometric standard deviation of mode i, respectively, and Ntot is total particle concentration of size distribution.
Figure 3
Figure 3
Cell count in bronchoalveolar lavage fluid. The effect of titanium dioxide (TiO2) inhalation exposure performed for 2 hours a day, three days a week, for four weeks at a concentration of 10 mg/m3 on macrophage, eosinophil, neutrophil and lymphocyte infiltration to bronchoalveolar lavage fluid (BALF) calculated from May-Grünwald-Giemsa (MGG)-stained cytospin slides with light microscopy (x80). Results are shown as cells per high power field (HPF) for healthy (PBS) and allergic (OVA) mice exposed to nanosized (nTiO2) or fine (fTiO2) TiO2 or left unexposed (-). From each slide the cells were counted from three fields from which an average was counted. N = 8 mice per group. The bars represent mean ± SEM; * P < 0.05 and ** P < 0.01 significantly different from unexposed control; Mann-Whitney U test.
Figure 4
Figure 4
Occurence of mucus producing cells in bronchioles. Periodic acid-Schiff (PAS) -stained mouse lung tissue, where mucus producing goblet cells can be seen in colour red around the bronchioles. Tissue samples from unexposed healthy (A) and asthmatic (B) mice and asthmatic mice exposed to nanosized (C; nTiO2) or fine (D; fTiO2) TiO2. (E) Effects of titanium dioxide exposure on the amount of mucus-producing cells around the bronchioles. Results are indicated as the average of PAS+ cells/100 μm of bronchus counted from three bronchioles per mouse (n = 8 mice per group) for healthy (PBS) and allergic (OVA) mice exposed to nanosized (nTiO2) or fine (fTiO2) TiO2 or left unexposed (-). N = 8 mice per group. The bars represent mean ± SEM; * P < 0.05 significantly different from unexposed control; Mann-Whitney U test.
Figure 5
Figure 5
Airway responsiveness to metacholine. Effect of airway responsiveness to metacholine (MCh) in allergic mice after exposure to nanosized (A; nTiO2) or fine (B; fTiO2) TiO2 for 2 hours a day, three days a week, for four weeks at a concentration of 10 mg/m3 (n = 8 mice per group). Results are shown as enhanced pause (Penh) values, dimensionless values that we used to empirically monitor airway function, in relation to increasing doses (1-100 mg/ml) of aerosolized MCh for healthy (PBS) and allergic (OVA) mice.
Figure 6
Figure 6
mRNA and protein expression of cytokines. Relative mRNA-expression in the lung tissue of (A) proinflammatory cytokines, IL-1β and TNF-α, (B) Th2 type cytokines IL-4 and IL-13, (C) regulatory cytokine IL-10 and marker of regulatory T-cells Foxp3. Protein levels (pg/ml) of proinflammatory cytokine TNF-α (D) and Th2-type cytokine IL-13 (E) in BAL supernatant of mice. Results are shown in relative units (RU) or (pg/ml) for healthy (PBS) and allergic (OVA) mice exposed for 2 hours a day, three days a week, for four weeks at a concentration of 10 mg/m3 to nanosized (nTiO2) or fine (fTiO2) TiO2 or left unexposed (-). N = 8 mice per group. The bars represent mean ± SEM; * P < 0.05, ** P < 0.01, and *** P < 0.001 significantly different from unexposed control; Mann-Whitney U test.
Figure 7
Figure 7
mRNA expression of chemokines. mRNA expression of proinflammatory chemokine CCL3 (A) and neutrophil attracting chemokines CXCL5 and CXCL2 (B) in the lung tissue of mice. Results are shown in relative units (RU) for healthy (PBS) and allergic (OVA) mice exposed for 2 hours a day, three days a week, for four weeks at a concentration of 10 mg/m3 to nanosized (nTiO2) or fine (fTiO2) TiO2 or left unexposed (-). N = 8 mice per group. The bars represent mean ± SEM; * P < 0.05, ** P < 0.01, and *** P < 0.001 significantly different from unexposed control; Mann-Whitney U test.
Figure 8
Figure 8
Protein levels of plated spleen cells. Protein levels (pg/ml) of TNF-α and IL-13 in the supernatant of plated spleen cells extracted from allergic mice exposed to nTiO2 for 2 hours a day, three days a week, for four weeks at a concentration of 10 mg/m3 or left unexposed (-). Cells were either stimulated with OVA or left untreated. N = 8 mice per group. The bars represent mean ± SEM; * P < 0.05 significantly different from unexposed control; Mann-Whitney U test.
Figure 9
Figure 9
Expression of antibodies. Levels of ovalbumin (OVA) specific antibodies IgE (A) and IgG2a (B). Results are shown in relative units (RU) for healthy (PBS) and allergic (OVA) mice exposed for 2 hours a day, three days a week, for four weeks at a concentration of 10 mg/m3 to nanosized (nTiO2) or fine (fTiO2) TiO2 or left unexposed (-). N = 8 mice per group. The bars represent mean ± SEM; ** P < 0.01 significantly different from unexposed control; Mann-Whitney U test.

References

    1. Lötvall J, Frew A, for the European Academy of Allergology and Clinical Immunology. Allergy: an epidemic that must be stopped. Brussels: European Academy of Allergology and Clinical Immunology; 2006. http://www.eaaci.net/media/PDF/E/820.pdf
    1. Weinmayr G, Weiland SK, Bjorksten B, Brunekreef B, Buchele G, Cookson WOC, Garcia-Marcos L, Gotua M, Gratziou C, van Hage M, von Mutius E, Riikjarv M-A, Rzehak P, Stein RT, Strachan DP, Tsanakas J, Wickens K, Wong GW. Isaac Phase Two Study Group. Atopic Sensitization and the International Variation of Asthma Symptom Prevalence in Children. Am J Respir Crit Care Med. 2007;176:565–574. doi: 10.1164/rccm.200607-994OC. - DOI - PubMed
    1. Yazdanbakhsh M, Kremsner PG, van Ree R. Allergy, Parasites, and the Hygiene Hypothesis. Science. 2002;296:490–494. doi: 10.1126/science.296.5567.490. - DOI - PubMed
    1. Gavett SH, Koren HS. The Role of Particulate Matter in Exacerbation of Atopic Asthma. International Archives of Allergy and Immunology. 2001;124:109–112. doi: 10.1159/000053685. - DOI - PubMed
    1. Nordenhall C, Pourazar J, Ledin MC, Levin JO, Sandstrom T, Adelroth E. Diesel exhaust enhances airway responsiveness in asthmatic subjects. Eur Respir J. 2001;17:909–915. doi: 10.1183/09031936.01.17509090. - DOI - PubMed

Publication types

MeSH terms