. 2010 Nov 25:6:25.
doi: 10.1186/1746-4811-6-25.

DPI-ELISA: a fast and versatile method to specify the binding of plant transcription factors to DNA in vitro

Affiliations

DPI-ELISA: a fast and versatile method to specify the binding of plant transcription factors to DNA in vitro

Luise H Brand et al. Plant Methods. .

Abstract

Background: About 10% of all genes in eukaryote genomes are predicted to encode transcription factors. The specific binding of transcription factors to short DNA-motifs influences the expression of neighbouring genes. However, little is known about the DNA-protein interaction itself. To date there are only a few suitable methods to characterise DNA-protein-interactions, among which the EMSA is the method most frequently used in laboratories. Besides EMSA, several protocols describe the effective use of an ELISA-based transcription factor binding assay e.g. for the analysis of human NFκB binding to specific DNA sequences.

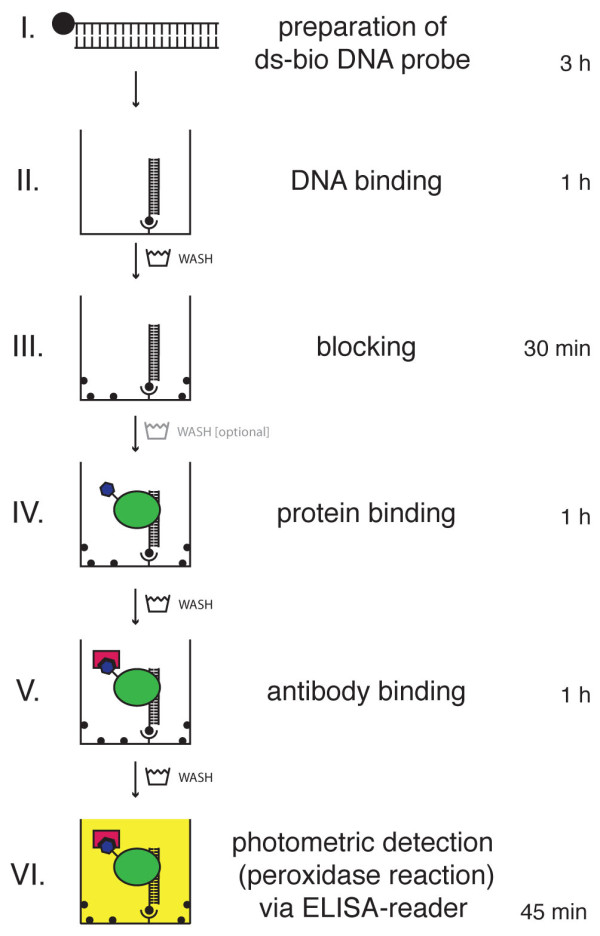
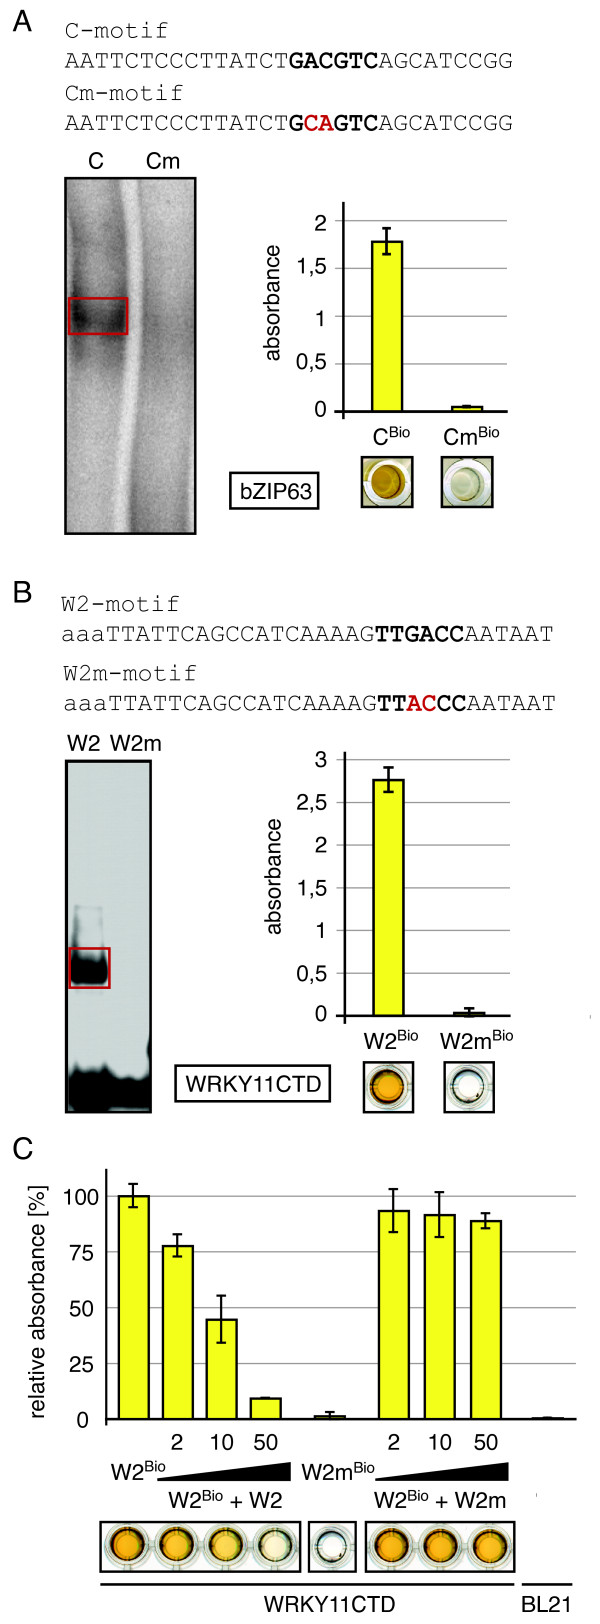
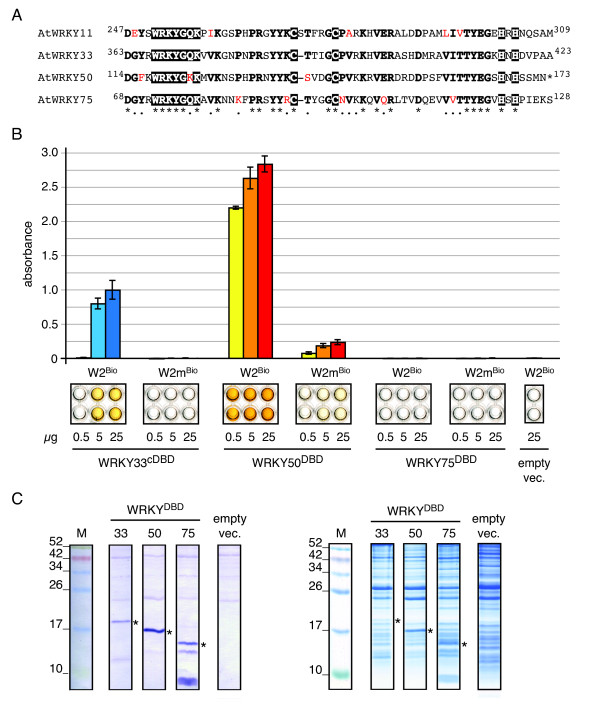
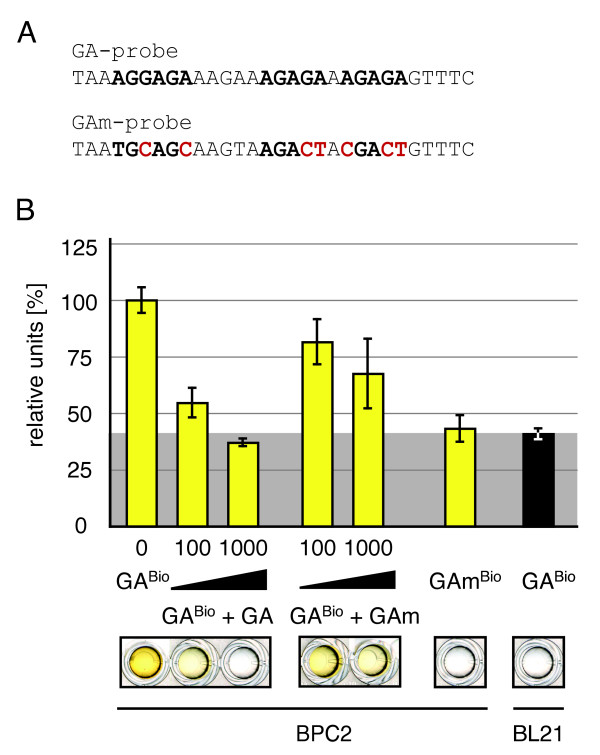
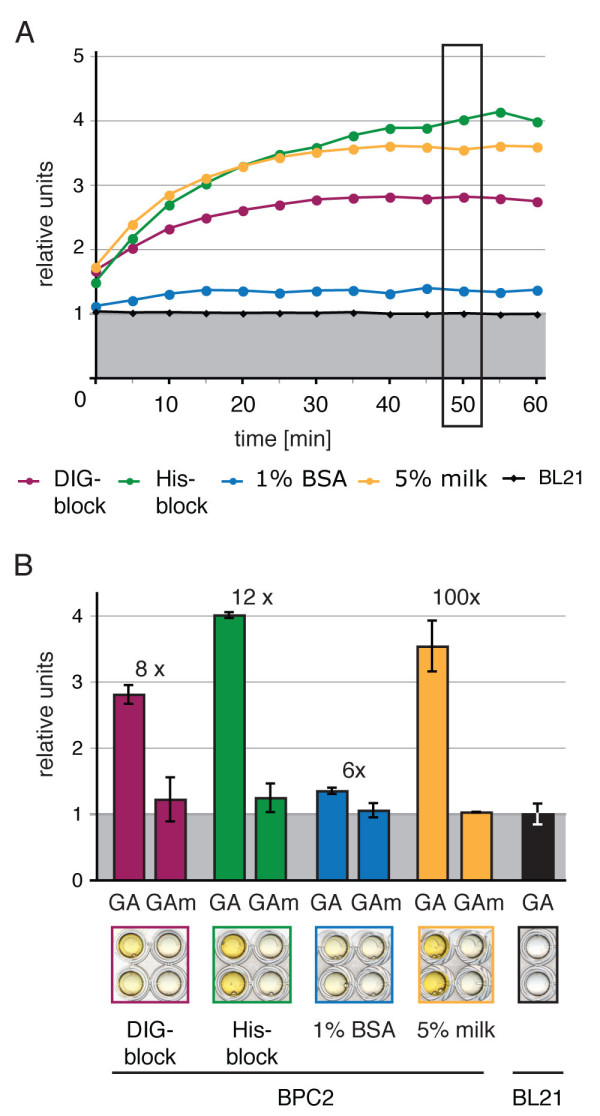
Results: We provide a unified protocol for this type of ELISA analysis, termed DNA-Protein-Interaction (DPI)-ELISA. Qualitative analyses with His-epitope tagged plant transcription factors expressed in E. coli revealed that EMSA and DPI-ELISA result in comparable and reproducible data. The binding of AtbZIP63 to the C-box and AtWRKY11 to the W2-box could be reproduced and validated by both methods. We next examined the physical binding of the C-terminal DNA-binding domains of AtWRKY33, AtWRKY50 and AtWRKY75 to the W2-box. Although the DNA-binding domain is highly conserved among the WRKY proteins tested, the use of the DPI-ELISA discloses differences in W2-box binding properties between these proteins. In addition to these well-studied transcription factor families, we applied our protocol to AtBPC2, a member of the so far uncharacterised plant specific Basic Pentacysteine transcription factor family. We could demonstrate binding to GA/TC-dinucleotide repeat motifs by our DPI-ELISA protocol. Different buffers and reaction conditions were examined.

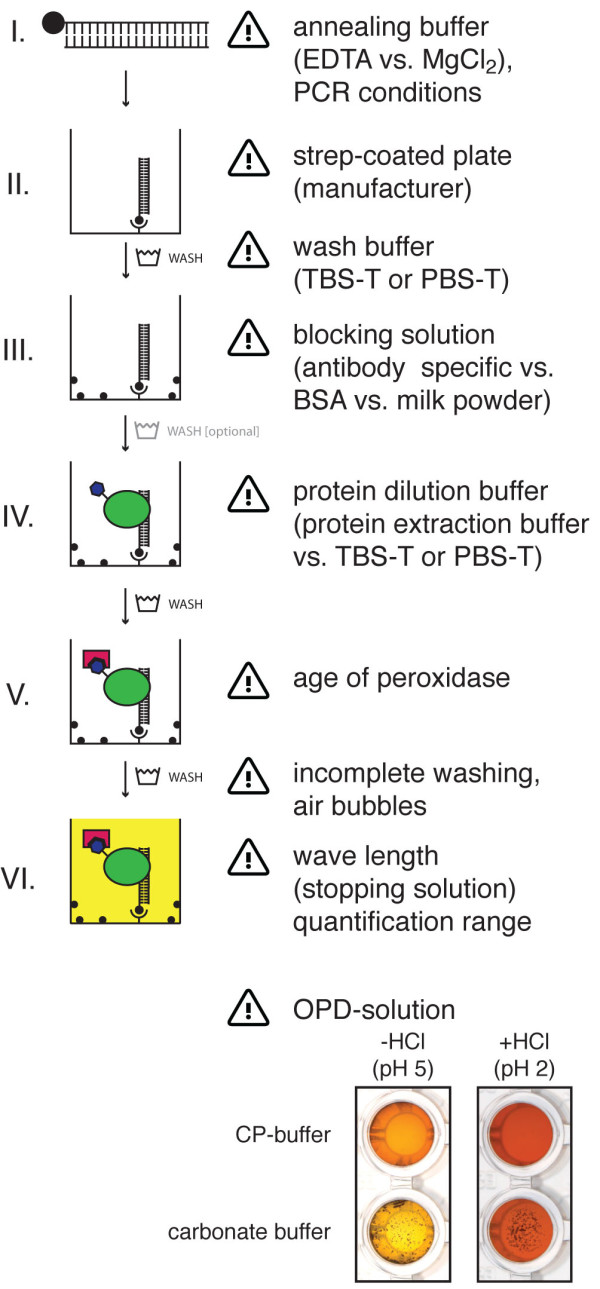
Conclusions: We successfully applied our DPI-ELISA protocol to investigate the DNA-binding specificities of three different classes of transcription factors from Arabidopsis thaliana. However, the analysis of the binding affinity of any DNA-binding protein to any given DNA sequence can be performed via this method. The DPI-ELISA is cost efficient, less time-consuming than other methods and provides a qualitative and quantitative readout. The presented DPI-ELISA protocol is accompanied by advice on trouble-shooting, which will enable scientists to rapidly establish this versatile and easy to use method in their laboratories.


Figures

Figure 1
Figure 1
Schematic workflow of the DPI-ELISA. Double stranded biotinylated (ds-bio) DNA-probes (I) are immobilised on a streptavidin-coated microtiter plate (II). After blocking the plate with an appropriate reagent (III), incubation with a crude protein extract from E. coli containing the epitope tagged protein under investigation is performed (IV). The epitope tagged protein is retained inside the well by physical binding to the immobilized DNA and, thus, can be detected with appropriate antibodies - which are conjugated with horseradish peroxidase in our experiments (V). Finally, peroxidase substrate (OPD) is added for the colorimetric quantification of specifically bound transcription factors to dsDNA-probes (VI). Between each of the workflow steps, at least three washing steps of the microtiter plate are performed; washing between steps III and IV is optional. Incubation times and approximate duration of the photometric detection step (peroxidase reaction) are given at the right hand side.
Figure 2
Figure 2
Comparison of the classical EMSA and the DPI-ELISA. The specific binding to DNA is investigated with plant transcription factors of two classes: AtbZIP63 (A.) and AtWRKY11DBD (B.). Specific binding of the recombinant proteins to double stranded (ds) DNA-probes by electrophoretic mobility shift assays (EMSA; left panel) or DPI-ELISA (right panel) is displayed. The sequences (top panel) of the dsDNA-probes are given in 5'-3'-orientation for the sense strand; changes of bases within the known binding consensi (bold face) are highlighted (red) in the mutated oligonucleotide versions [13,14]. For EMSA, specific retardation bands are highlighted by red boxes; for the DPI-ELISA a picture of the respective plate-wells is displayed below each column of the histogram graph. A. Renatured AtbZIP63 is tested with double stranded C- and Cm-probes. B. AtWRKY11DBD contained in crude protein extract from E. coli is tested with double stranded W2- and W2m-probes. Both experiments (A. + B.) confirm results from previous publications [13,14]. C. Competition experiment: The specific binding of AtWRKY11DBD to W2-probes is competed with non-biotinylated dsDNA. Different amounts of W2- or W2m-probe (0, 2, 10, 50 pmol) were added to AtWRKY11DBD crude extract immediately prior the plate incubation. ELISA-plates are coated with 2 pmol of double stranded biotinylated W2Bio-probe. The biotinylated dsDNA W2mBio-probe incubated with AtWRKY11DBD extract or the W2Bio-probe incubated with BL21/RIL cells (transformed with an empty vector construct) serve as negative control.
Figure 3
Figure 3
DNA-binding capacity of Arabidopsis thaliana WRKY33cDBD, WRKY50DBD and WRKY75DBD to the W2-probe. A. Amino acid alignment of WRKY11, WRKY33, WRKY50 and WRKY75 DNA-binding domain (DBD) sequences. The highly conserved WRKY-consensus and the zinc-finger are highlighted (white on black); conserved amino acid residues are displayed in bold face. Non-conserved residues that might contribute to differences in WRKY-domain function by altering the binding specificities are highlighted in red. B. DPI-ELISA results for AtWRKY33cDBD, AtWRKY50DBD and AtWRKY75DBD binding to the W2- or W2m-probes. Different amounts of extracts (0.5, 5, 25 μg total protein per well) were examined with W2Bio- and W2mBio-probes. Representative wells of the microtiter plate are shown below the graph for visual inspection. C. Detection of the immobilized His-epitope tagged proteins with anti-His-antibodies in the crude extract by western blotting using (left). Asterisks indicate the appropriate bands (AtWRKY33cDBD - 20 kDa, AtWRKY50DBD - 17 kDa, AtWRKY75DBD - 15 kDa). Coomassie-stained SDS-PAGE (right) is shown for equal loading of the gel.
Figure 4
Figure 4
Employing the DPI-ELISA to other transcription factors. A. The DNA-sequences of the double stranded GA-probe and the mutated oligonucleotide version (GAm-probe) are given in 5' to 3'-orientation for the sense strand; mutated bases are highlighted (red) [25]. The specific binding of AtBPC2 to the GABio-probe was shown by a competition experiment with non-biotinylated dsDNA (B.). Different amounts of GA- or GAm-probes (0, 100, 1000 pmol) were added to AtBCP2 crude extract and incubated on an ELISA-plate coated with 2 pmol of biotinylated GABio-probe. The biotinylated double stranded GAmBio-probe incubated with AtBPC2 extract served as negative control. Representative wells of the microtiter plate are shown below the graph for visual inspection. The grey background indicates the negative control (untransformed BL21/RIL cells) reference values in percent.
Figure 5
Figure 5
The absorbance of positive DNA-protein-interaction is affected by blocking reagents. Changes in binding affinity and fold differences between positive and negative DNA-protein interaction for different blocking reagents are analysed with AtBPC2 and GA- or GAm-probes (A. + B.): α-DIG blocking reagent (DIG-block), α-His blocking reagent (His-block), 1% bovine serum albumin (BSA) in TBS-T and 5% non-fat dried milk in TBS-T (milk). A. The average OPD-turnover is measured in an experiment over 60 min. B. The normalised values and standard deviations at 50 minutes incubation time are graphed as histograms for the four different blocking reagents. The background-normalised fold-differences are given above the respective columns. Representative wells of the microtiter plate are shown below the graph for visual inspection. The grey background indicates the negative control (untransformed BL21/RIL cells) reference values.
Figure 6
Figure 6
Influence of measurement wavelength on absorbance values. A. The OPD-solution at pH 5 shows the highest maximum absorbance at 450 nm (purple curve). The peroxidase reaction is stopped for end-point measurements by acidification (addition of stopping solution), which leads to a shift in the absorbance spectrum with an absorbance maximum at 490 nm (green curve). B. + C. Dilution series of OPD-reaction product in CP-buffer is displayed along the x-axis [log scale]. Concentration dependent differences in the absorbance values measured at 450 nm and 490 nm before (purple lines) and after the addition of stopping solution (green lines). B. Range of linear relationship between the measurements at the two wavelengths is highlighted by coloured backgrounds. C. The relative difference between the measurements of the stopped solution [A450/A490] is ~40%, while it is ~46% for the non-stopped reaction [A490/A450].
Figure 7
Figure 7
Notes for trouble-shooting. The figure provides an overview of crucial points of the DPI-ELISA and notes for trouble-shooting. At the bottom of the panel the effects of different OPD-solution buffers are shown: A carbonate buffer will lead to the precipitation of the coloured OPD-reaction product, if it accumulates to high amounts. Interestingly the sediment dissolves slowly after stopping the reaction with hydrochloric acid (data not shown). In contrast, a transparent solution is obtained with the CP-buffer before and after addition of stopping solution.

References

    1. Berendzen KW, Harter K, Wanke D. Analysis of plant regulatory DNA sequences by transient protoplast assays and computer aided sequence evaluation. Methods Mol Biol. 2009;479:311–335. - PubMed
    1. Wanke D, Harter K. Analysis of plant regulatory DNA sequences by the yeast-one-hybrid assay. Methods Mol Biol. 2009;479:291–309. - PubMed
    1. Chorley BN, Wang X, Campbell MR, Pittman GS, Noureddine MA, Bell DA. Discovery and verification of functional single nucleotide polymorphisms in regulatory genomic regions: Current and developing technologies. Mutat Res-Rev Mutat. 2008;659:147–157. - PMC - PubMed
    1. Cann JR. Theoretical studies on the mobility-shift assay of protein-DNA complexes. Electrophoresis. 1998;19:127–141. doi: 10.1002/elps.1150190202. - DOI - PubMed
    1. Hudson ME, Snyder M. High-throughput methods of regulatory element discovery. Biotechniques. 2006;41:673, 675, 677 passim. doi: 10.2144/000112322. - DOI - PubMed