. 2010 Dec 1;12(6):593-605.
doi: 10.1016/j.cmet.2010.11.011.

The inflammasome-mediated caspase-1 activation controls adipocyte differentiation and insulin sensitivity

Affiliations

The inflammasome-mediated caspase-1 activation controls adipocyte differentiation and insulin sensitivity

Rinke Stienstra et al. Cell Metab. .

Abstract

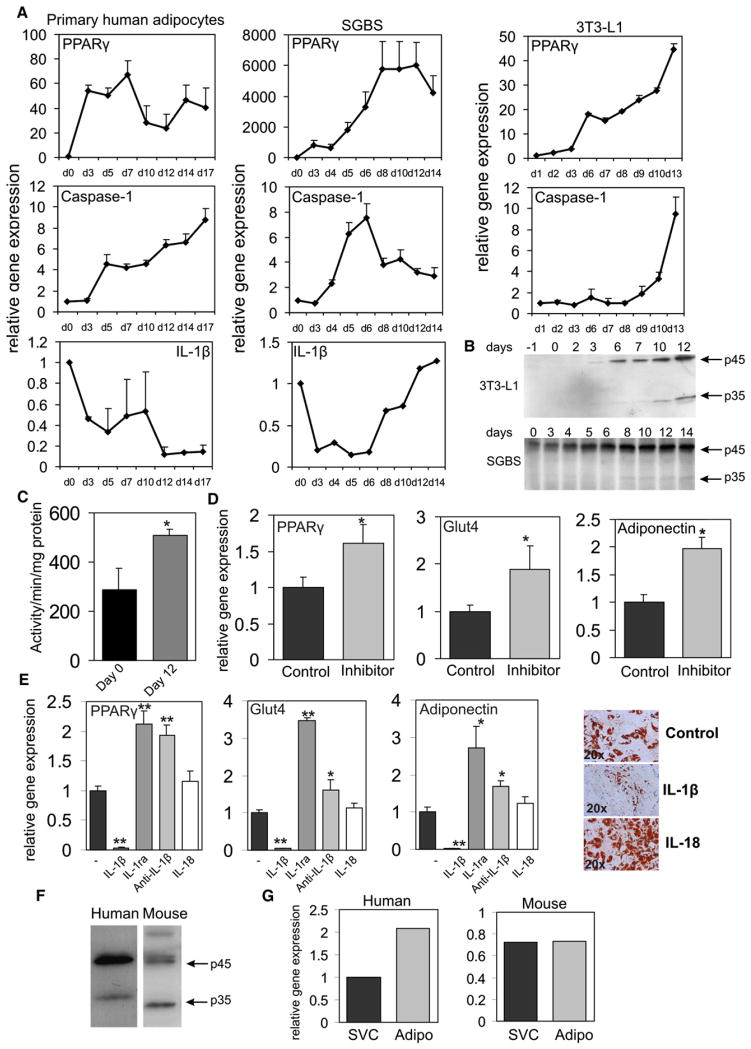
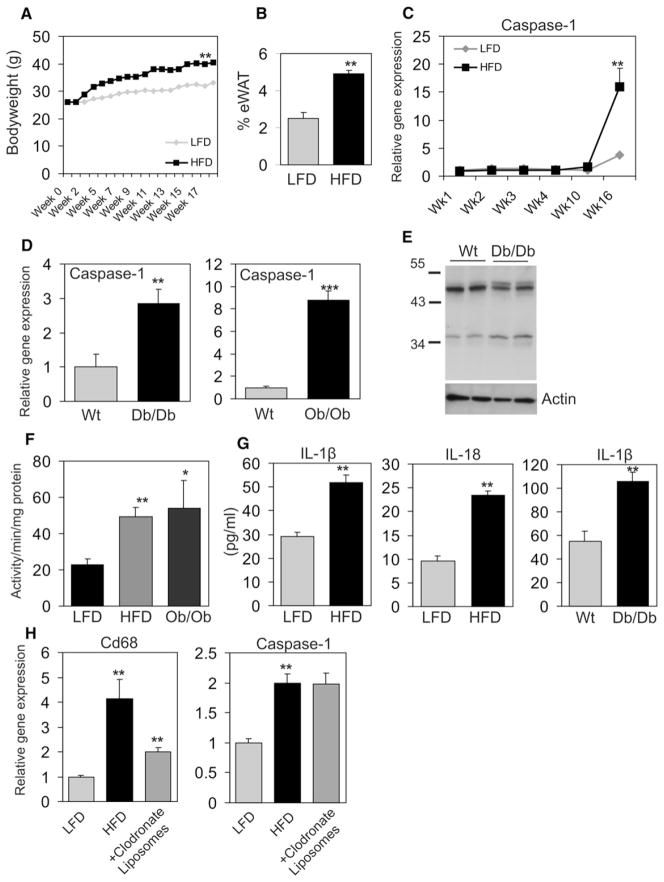
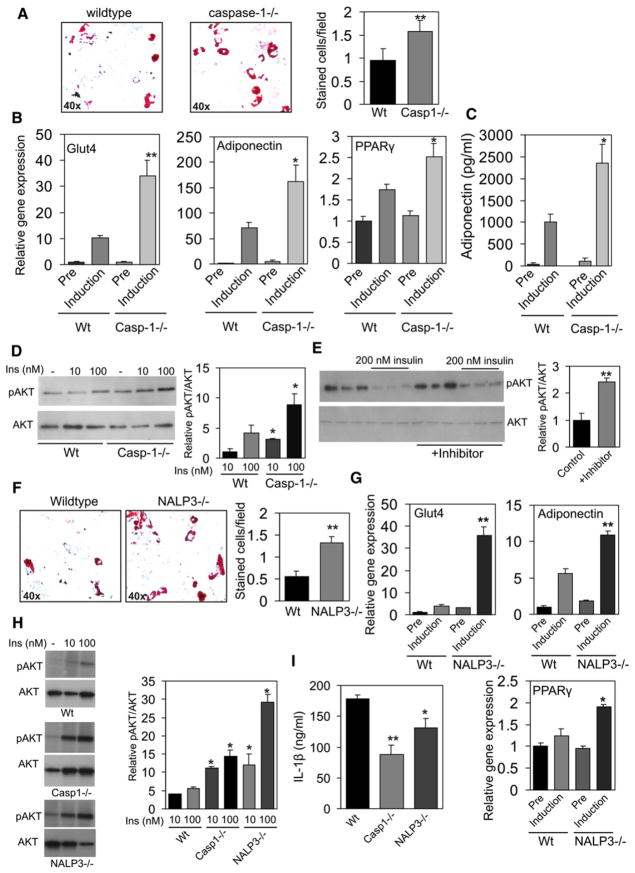
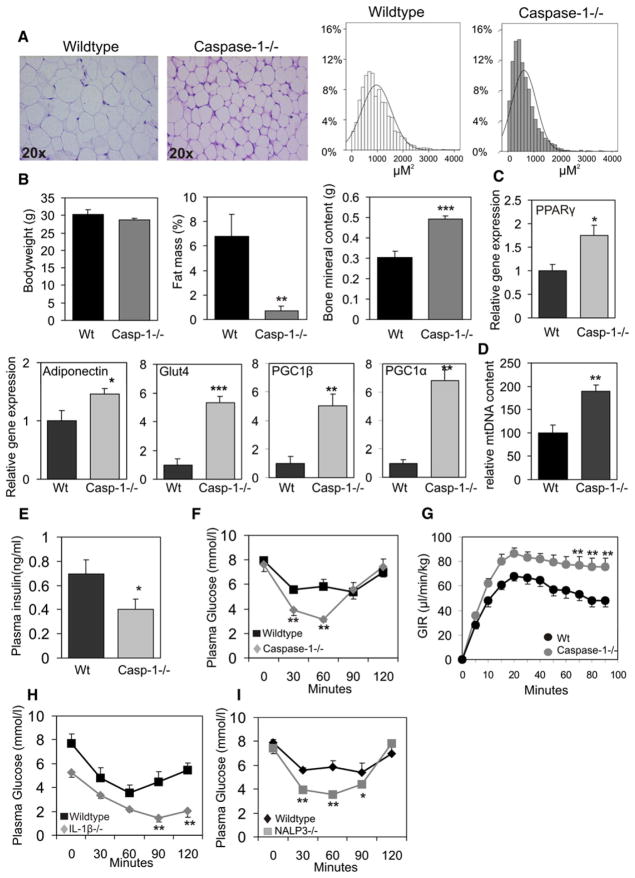
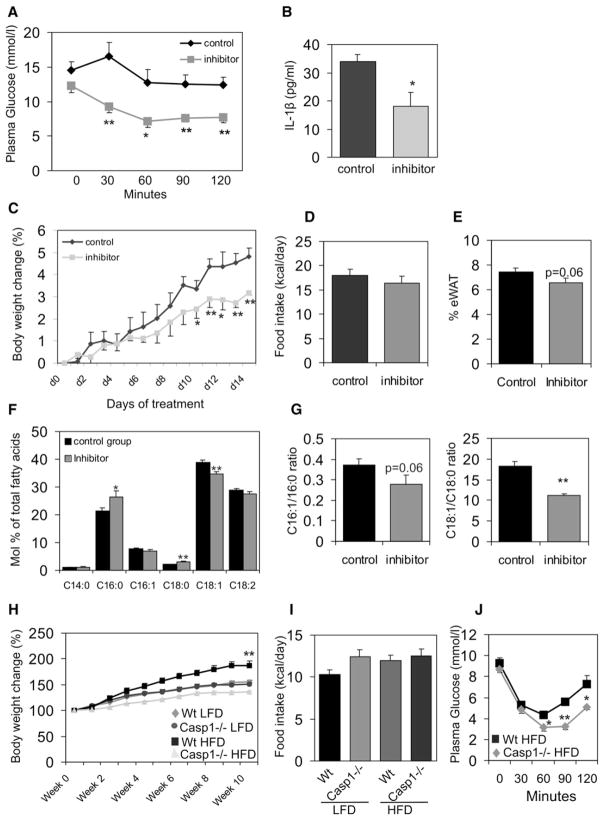
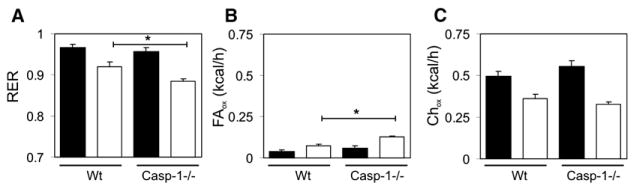
Obesity-induced inflammation originating from expanding adipose tissue interferes with insulin sensitivity. Important metabolic effects have been recently attributed to IL-1β and IL-18, two members of the IL-1 family of cytokines. Processing of IL-1β and IL-18 requires cleavage by caspase-1, a cysteine protease regulated by a protein complex called the inflammasome. We demonstrate that the inflammasome/caspase-1 governs adipocyte differentiation and insulin sensitivity. Caspase-1 is upregulated during adipocyte differentiation and directs adipocytes toward a more insulin-resistant phenotype. Treatment of differentiating adipocytes with recombinant IL-1β and IL-18, or blocking their effects by inhibitors, reveals that the effects of caspase-1 on adipocyte differentiation are largely conveyed by IL-1β. Caspase-1 and IL-1β activity in adipose tissue is increased both in diet-induced and genetically induced obese animal models. Conversely, mice deficient in caspase-1 are more insulin sensitive as compared to wild-type animals. In addition, differentiation of preadipocytes isolated from caspase-1(-/-) or NLRP3(-/-) mice resulted in more metabolically active fat cells. In vivo, treatment of obese mice with a caspase-1 inhibitor significantly increases their insulin sensitivity. Indirect calorimetry analysis revealed higher fat oxidation rates in caspase-1(-/-) animals. In conclusion, the inflammasome is an important regulator of adipocyte function and insulin sensitivity, and caspase-1 inhibition may represent a novel therapeutic target in clinical conditions associated with obesity and insulin resistance.


Figures

Figure 1
Figure 1. Caspase-1 Is Activated during Adipogenesis In Vitro and Is Present in Adipocytes of Mouse and Human White Adipose Tissue In Vivo
(A) Quantitative PCR analysis of differentiating human or mouse adipocytes. Representative results are shown of n = 3 experiments. (B) Western blot analysis of caspase-1 protein levels in differentiating mouse 3T3-L1 adipocytes and human SGBS adipocytes. Protein marker is given in kDalton. (C) Caspase-1 activity in preadipocytes (Pre) and adipocytes at day 8 of differentiation (Mature). (D) Quantitative PCR analysis of SGBS adipocytes differentiated for 12 days in the presence of the specific caspase-1 inhibitor Pralnacasan at 100 μM. (E) Quantitative PCR analysis and representative oil red O staining of SGBS adipocytes differentiated for 7 days in the presence of recombinant IL-1β (10 ng/ml), IL-1ra (5 μg/ml), anti-IL-1β antibody (5 μg/ml), or IL-18 (25 ng/ml). (F) Western blot analysis of caspase-1 in total human and mouse white adipose tissue. Protein marker is given in kDalton. (G) Caspase-1 expression in the stromal vascular cells and mature adipocytes fractionated from total white adipose tissue. Data are presented as mean ± SEM. Asterisks depict statistically significant differences between control and experimental groups. *p < 0.05, **p < 0.005.
Figure 2
Figure 2. Caspase-1 Is Activated in Adipocytes of Diet-Induced and Genetically Induced Obese Animals
(A) Bodyweight development in male wild-type C57/bl6 animals (2 months of age at start of intervention) fed either a LFD or HFD (n = 10 per group). (B) Percent of epidydimal white adipose tissue after 17 weeks of HFD feeding. (C) Quantitative PCR analysis of caspase-1 gene expression in white adipose tissue of C57/Bl6 animals during dietary intervention (n = 6 per group). (D) White adipose tissue of wild-type, db/db, and ob/ob animals (4 months of age) is analyzed for caspase-1 gene expression levels using quantitative PCR analysis (n = 5 per group). (E) Western blot analysis of caspase-1 in white adipose tissue of WT and db/db animals. Actin levels are shown as loading control. (F) Caspase-1 activity levels measured in total white adipose tissue of LFD- or HFD-fed animals and ob/ob mice. (G) IL-1β and IL-18 concentrations (pg/ml) measured in total white adipose tissue of WT animals fed a LFD or HFD and IL-1β concentrations (pg/ml) present in white adipose tissue of WT and db/db mice (n = 5 per group). (H) Gene expression levels of CD68 and caspase-1 in white adipose tissue of wild-type animals (2 months of age at start of intervention) fed a LFD or a HFD for 16 weeks and a HFD followed by intraperitoneal injection with clodronate liposomes. Data are presented as mean ± SEM. Asterisks depict statistically significant differences between control and experimental groups. *p < 0.05, **p < 0.005, ***p < 0.001.
Figure 3
Figure 3. Absence of Caspase-1 and NLRP3 Improves Adipogenesis and Insulin Sensitivity in Differentiated Adipocytes
(A) Representative oil red O staining pictures and quantification of WT and caspase-1-deficient preadipocytes differentiated toward adipocytes for 7 days. (B) GLUT4, adiponectin, and PPARγ gene expression levels as determined by quantitative real-time PCR in preadipocytes (Pre) or differentiated adipocytes (Induction) from WT or caspase-1-deficient animals. (C) Adiponectin concentrations (pg/ml) measured in medium of preadipocytes (Pre) or adipocytes (Induction) differentiated for 7 days from WT or caspase-1-deficient animals. (D) Western blot analysis of phosphorylated AKT and total AKT levels after insulin treatment for 20 min in adipocytes differentiated for 7 days. (E) Western blot analysis of phosphorylated AKT and total AKT levels after 20 min of insulin treatment in mature SGBS adipocytes pretreated overnight with 200 nM of insulin and/or the caspase-1 inhibitor pralnacasan (100 μM). (F) Representative oil red O staining pictures and quantification of WT and NLRP3-deficient preadipocytes differentiated toward adipocytes for 7 days. (G) GLUT4, Adiponectin, and PPARγ gene expression levels in preadipocytes (Pre) or differentiated adipocytes (Induction) from WT or NALP3-deficient animals. (H) Western blot analysis of phosphorylated AKT and total AKT levels in white adipose tissue explants from wild-type, caspase-1−/−, and NLRP3−/− animals (2 months of age) after 20 min of insulin treatment. (I) IL-1β production of adipose tissue explants from WT, caspase-1−/−, and NLRP3−/− animals after 24 hr of culturing. Data are presented as mean ± SEM. Asterisks depict statistically significant differences between control and experimental groups. *p < 0.05, **p < 0.005.
Figure 4
Figure 4. Caspase-1 Contributes to Adipose Tissue Formation and Function In Vivo
(A) Representative HE staining of white adipose tissue and quantification of adipocyte size. (B) Total bodyweight, percentage of fat mass, and bone mineral content of WT and caspase-1−/− mice (6 months of age). (C) Gene expression analysis of total white adipose of WT and caspase-1-deficient mice using real-time quantitative PCR techniques. (D) mtDNA content of total white adipose tissue from WT and caspase-1−/− animals. (E) Plasma insulin levels in nonfasted WT and caspase-1-deficient animals (n = 9 per group). (F) Insulin tolerance test in WT and caspase-1-deficient animals (n = 9 per group). (G) Assessment of whole-body insulin resistance by euglycemic hyperinsulinemic clamp analysis in wild-type (n = 17) and caspase-1−/− (n = 18) animals at 1 year of age. Glucose infusion rates (GIR) during the euglycemic hyperinsulinemic clamp analysis are shown. (H) Insulin tolerance test in WT and IL-1β-deficient animals (n = 5 per group). (I) Insulin tolerance test in WT and NALP3-deficient animals (n = 5 per group). Data are presented as mean ± SEM. Asterisks depict statistically significant differences between control and experimental groups. *p < 0.05, **p < 0.005, ***p < 0.001.
Figure 5
Figure 5. Caspase-1 Blockage Improves Insulin Sensitivity
(A) Insulin tolerance test in male ob/ob animals (2 months of age at start of intervention) orally treated with a chemical caspase-1 inhibitor (Pralnacasan) or vehicle for 2 weeks (n = 5 per group). (B) IL-1β concentrations (pg/ml) measured in total white adipose tissue of ob/ob mice receiving vehicle or a caspase-1 inhibitor (n = 5 per group). (C) Bodyweight change (in %) during oral treatment of ob/ob animals with vehicle or a caspase-1 inhibitor (n = 5 per group). (D) Food intake (kcal/day) of ob/ob animals orally treated with a chemical caspase-1 inhibitor or vehicle for 2 weeks. (E) Percentage of epididymal white adipose tissue. (F) Lipid composition of white adipose tissue. (G) Desaturation indexes in vehicle or caspase-1 inhibitor-treated animals. (H) Bodyweight development of WT or caspase-1−/− animals (2 months of age at start of intervention) fed a LFD or HFD for 10 weeks (n = 10 per group). (I) Food intake (kcal/day) of WT or caspase-1−/− fed a LFD or HFD. (J) Insulin tolerance test in WT and caspase-1−/− animals fed a HFD for 10 weeks (n = 5 per group). Data are presented as mean ± SEM. Asterisks depict statistically significant differences between control and experimental groups.*p < 0.05, **p < 0.005.
Figure 6
Figure 6. Absence of Caspase-1 Augments Fat Oxidation Rate
(A) Respiratory exchange rates, (B) fat oxidation, and (C) carbohydrate oxidation levels in WT and caspase-1−/− animals. Black and white bars represent mean nocturnal and diurnal data ± SEM, respectively. Asterisk indicates p < 0.05.

References

    1. Dumasy V, Delhaye M, Cotton F, Deviere J. Fat malabsorption screening in chronic pancreatitis. Am J Gastroenterol. 2004;99:1350–1354. - PubMed
    1. Guilherme A, Virbasius JV, Puri V, Czech MP. Adipocyte dysfunctions linking obesity to insulin resistance and type 2 diabetes. Nat Rev Mol Cell Biol. 2008;9:367–377. - PMC - PubMed
    1. Gurcel L, Abrami L, Girardin S, Tschopp J, van der Goot FG. Caspase-1 activation of lipid metabolic pathways in response to bacterial pore-forming toxins promotes cell survival. Cell. 2006;126:1135–1145. - PubMed
    1. Handschin C, Spiegelman BM. Peroxisome proliferator-activated receptor gamma coactivator 1 coactivators, energy homeostasis, and metabolism. Endocr Rev. 2006;27:728–735. - PubMed
    1. He F, Doucet JA, Stephens JM. Caspase-mediated degradation of PPARgamma proteins in adipocytes. Obesity. 2008;16:1735–1741. - PubMed

Publication types

MeSH terms