. 2010 Dec 7;20(23):2112-6.
doi: 10.1016/j.cub.2010.11.017. Epub 2010 Nov 25.

Spatial heterogeneity in the perception of face and form attributes

Affiliations

Spatial heterogeneity in the perception of face and form attributes

Arash Afraz et al. Curr Biol. .

Abstract

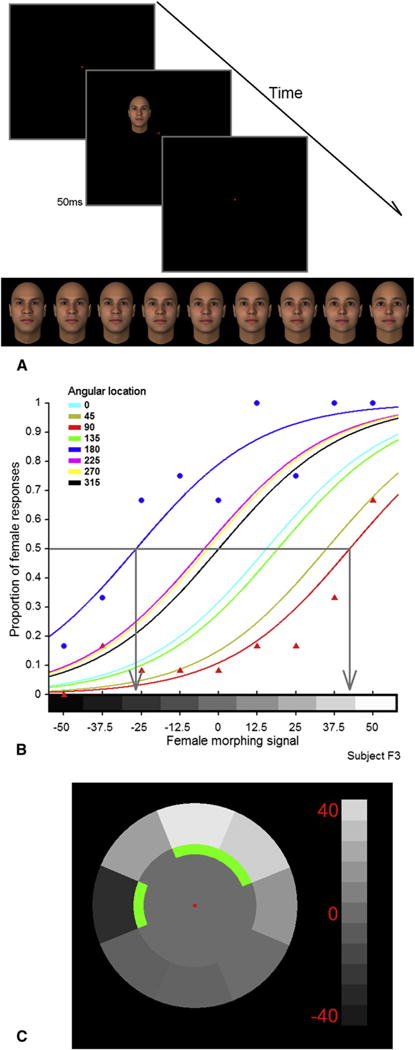
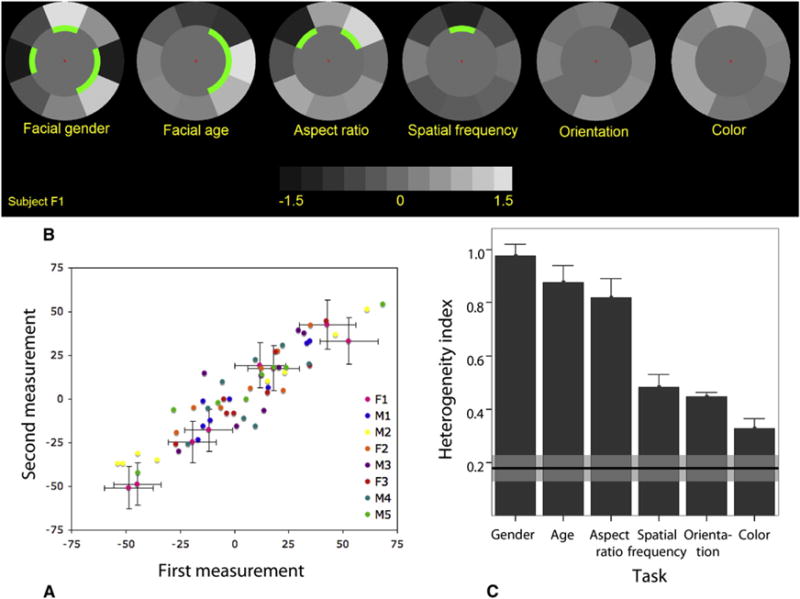
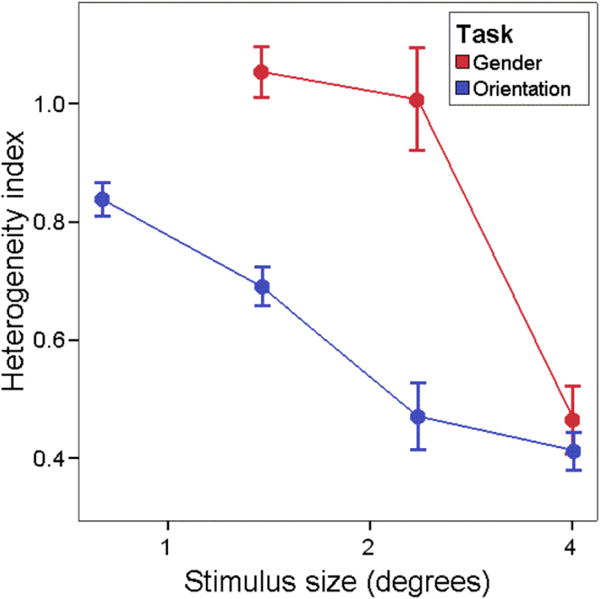
The identity of an object is a fixed property, independent of where it appears, and an effective visual system should capture this invariance [1-3]. However, we now report that the perceived gender of a face is strongly biased toward male or female at different locations in the visual field. The spatial pattern of these biases was distinctive and stable for each individual. Identical neutral faces looked different when they were presented simultaneously at locations maximally biased to opposite genders. A similar effect was observed for perceived age of faces. We measured the magnitude of this perceptual heterogeneity for four other visual judgments: perceived aspect ratio, orientation discrimination, spatial-frequency discrimination, and color discrimination. The effect was sizeable for the aspect ratio task but substantially smaller for the other three tasks. We also evaluated perceptual heterogeneity for facial gender and orientation tasks at different spatial scales. Strong heterogeneity was observed even for the orientation task when tested at small scales. We suggest that perceptual heterogeneity is a general property of visual perception and results from undersampling of the visual signal at spatial scales that are small relative to the size of the receptive fields associated with each visual attribute.


Figures

Figure 1
Figure 1. Heterogeneity of Facial Gender Perception across the Visual Field
(A) Experimental paradigm. The stimuli (faces selected from a morphing spectrum between male and female prototypes) were shown for 50 ms in one of the eight possible locations around the fixation point. Subjects had to indicate the stimuli’s gender by pressing a key. (B) Psychometric functions. The horizontal axis shows the face morphing level. Positive values indicate female faces (lighter shades), and negative values stand for male faces (dark shades). The vertical axis indicates the proportion of female responses. Colored curves show the logistic fits to the psychometric results for the eight tested locations separately. The angular location of the eight locations are color coded (angles begin at 0° to the right of the fixation and increase in the counterclockwise direction). Actual data points are shown only for the leftmost and rightmost curves to avoid visual clutter. The two gray arrows indicate points of subjective equality (PSEs) of the most female-biased (left) and the most male-biased (right) curves. (C) Gender PSE mosaic. The same results are shown as a shaded radial mosaic. Each location on the mosaic corresponds to the same tested location around the fixation point. The gray level shade indicates the PSE at each spot. The green arcs indicate statistical significance of the deviation of the PSE from the average (logistic regression α = 0.001, Bonferroni corrected).
Figure 2
Figure 2. Stability of the Original Effect across Time and the Perceptual Heterogeneity for Six Visual Tasks
(A) Scatter plot comparing the first and second measurements of PSEs for eight subjects at each of the eight locations. (B) PSE mosaics for the five visual tasks for one of the subjects. To make it possible to compare the heterogeneity magnitude across five different tasks, we normalized PSEs of each task to the corresponding just noticeable difference (JND). The color map indicates PSE/JND. (C) Heterogeneity indices. The bar plot demonstrates the perceptual heterogeneity index (see Results) for the five investigated visual tasks. The horizontal black line and gray band indicate the mean ± 1 standard error (SE) of the heterogeneity index expected with local biases due only to noise (based on Monte Carlo simulation). Error bars show ±1 SE of mean.
Figure 3
Figure 3. The Effect of Stimulus Size on Perceptual Heterogeneity
Heterogeneity indices are reported for facial gender and orientation discrimination tasks with various sizes of the visual stimulus. The face stimuli were not tested for the 0.8° stimulus size because gender recognition in the periphery at that size is impossible. Heterogeneity index systematically and significantly increases for both tasks at the stimulus size drops. See Figure S5 for examples of the psychometric functions underlying this figure. Error bars show ±1 SE of mean.

References

    1. Biederman I, Cooper EE. Evidence for complete translational and reflectional invariance in visual object priming. Perception. 1991;20:585–593. - PubMed
    1. DiCarlo JJ, Cox DD. Untangling invariant object recognition. Trends Cogn Sci (Regul Ed) 2007;11:333–341. - PubMed
    1. Gross CG, Rocha-Miranda CE, Bender DB. Visual properties of neurons in inferotemporal cortex of the Macaque. J Neurophysiol. 1972;35:96–111. - PubMed
    1. Ferrario VF, Sforza C, Pizzini G, Vogel G, Miani A. Sexual dimorphism in the human face assessed by euclidean distance matrix analysis. J Anat. 1993;183:593–600. - PMC - PubMed
    1. Burton AM, Bruce V, Dench N. What’s the difference between men and women? Evidence from facial measurement Perception. 1993;22:153–176. - PubMed

Publication types

LinkOut - more resources