

doi: 10.1093/nar/gkq1212.
Epub 2010 Nov 24.
A new repeat-masking method enables specific detection of homologous sequences
Affiliations
- PMID: 21109538
- PMCID: PMC3045581
- DOI: 10.1093/nar/gkq1212
Item in Clipboard
A new repeat-masking method enables specific detection of homologous sequences
Nucleic Acids Res.
2011 Mar.
Abstract
Biological sequences are often analyzed by detecting homologous regions between them. Homology search is confounded by simple repeats, which give rise to strong similarities that are not homologies. Standard repeat-masking methods fail to eliminate this problem, and they are especially ill-suited to AT-rich DNA such as malaria and slime-mould genomes. We present a new repeat-masking method, TANTAN, which is motivated by the mechanisms that create simple repeats. This method thoroughly eliminates spurious homology predictions for DNA-DNA, protein-protein and DNA-protein comparisons. Moreover, it enables accurate homology search for non-coding DNA with extreme A + T composition.
Figures
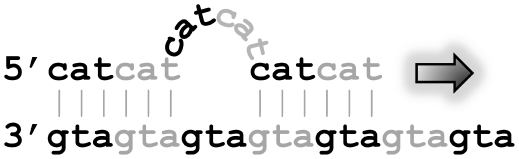
Strand slippage during DNA synthesis. The arrow indicates the synthesis of the top strand.
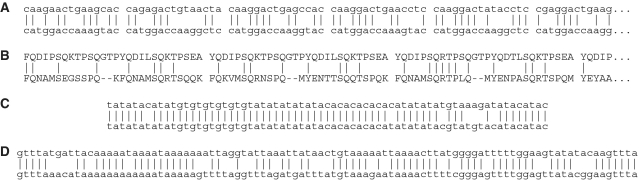
Examples of spurious alignments found despite masking repeats. (A) C. elegans DNA (upper) versus reversed P. pacificus DNA (lower), after masking both with Dust Masker . (B) A vertebrate protein (upper) versus a reversed plant protein (lower), after masking both with Seg Masker . (C) Human DNA (upper) versus reversed opossum DNA (lower), after masking both with trf . (D) A. thaliana DNA (upper) versus reversed P. patens DNA (lower), after masking both with trf .
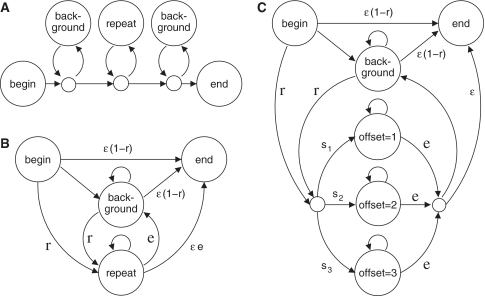
Three models of a sequence with repetitive regions. (A) A model that allows one repetitive region, flanked by random background letters. (B) A model that allows multiple repetitive regions, separated by random background letters. (C) A model that allows multiple repetitive regions with different repeat offsets. A repeat offset of (say) three means that each letter tends to resemble the one three positions previous.
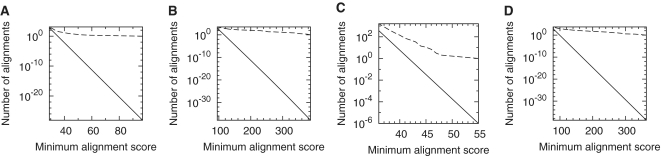
Alignments of reversed sequences after repeat-masking method. The dashed line is the observed number of alignments, and the solid line is the expected number for random sequences. Alignments between: (A) the C. elegans genome and the reversed P. pacificus genome, after masking both with Dust Masker ; (B) vertebrate proteins and reversed plant proteins, after masking both with Seg Masker ; (C) the human genome and the reversed opossum genome, after masking both with trf ; (D) the P. falciparum genome and the reversed D. discoideum genome, after masking both with Dust Masker .
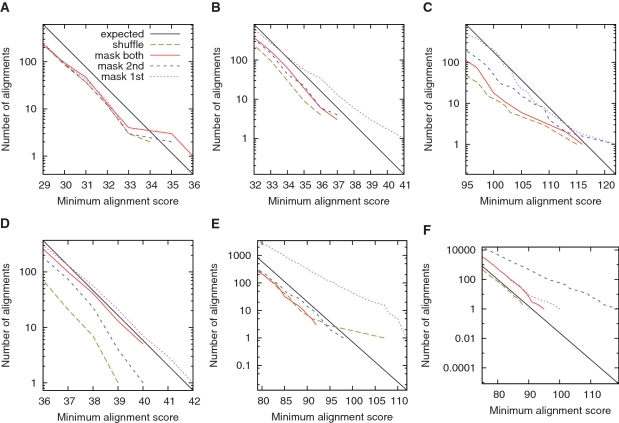
Alignments of reversed sequences after masking repeats with tantan . Alignments between: (A) the C. elegans genome and the reversed P. pacificus genome; (B) the A. thaliana genome and the reversed P. patens genome; (C) vertebrate proteins and reversed plant proteins; (D) the human genome and the reversed opossum genome; (E) the P. falciparum genome and the reversed D. discoideum genome; (F) the P. falciparum genome and the reversed human genome. The colors indicate alignments after: masking both sets of sequences (solid red); masking the first-named set only (dotted magenta); masking the second-named set only (dashed blue); shuffling the letters in each set (dashed brown). The black lines indicate the expected number of alignments for random sequences.
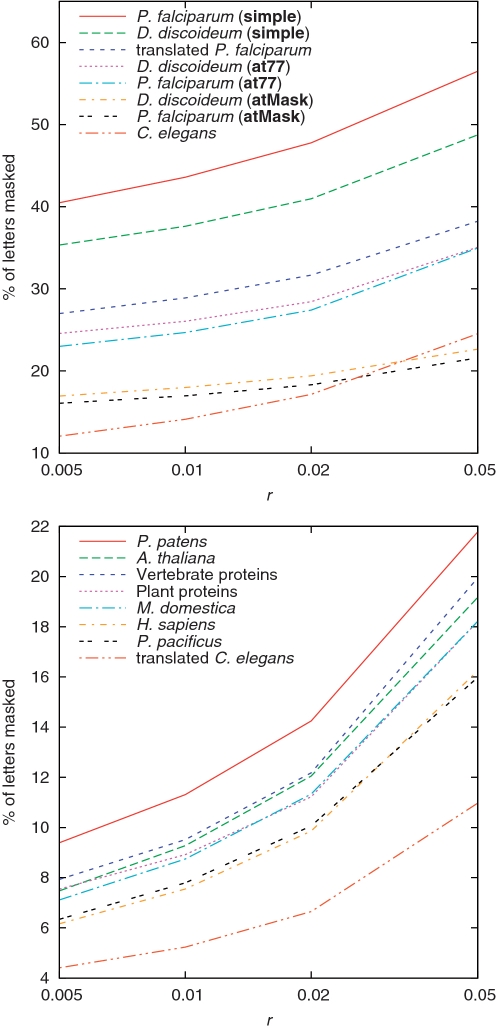
Percent of letters that get masked by tantan , as we vary its r parameter (Figure 3C). For P. falciparum and D. discoideum, we also varied tantan 's scoring matrix.
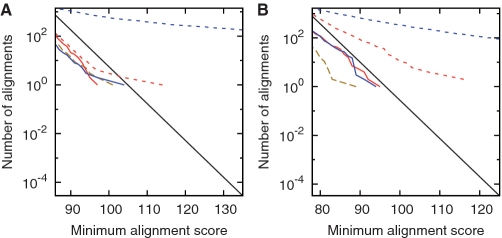
Alignments between DNA sequences and reversed protein sequences, after masking repeats with tantan . Alignments between: (A) the C. elegans genome and reversed plant proteins; (B) the P. falciparum genome and reversed vertebrate proteins. The colors indicate alignments after: masking the proteins, and the DNA at the protein level (solid red); masking the proteins, and the DNA at the DNA level (solid blue); masking the proteins only (dashed red); masking the DNA only, at the DNA level (dashed blue); shuffling the letters in each set (dashed brown). The black lines indicate the expected number of alignments for random sequences.
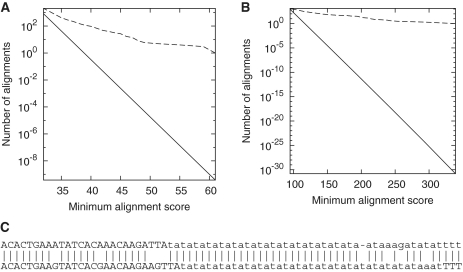
Alignments of reversed sequences after soft-masking repeats with tantan . Alignments between: (A) the A. thaliana genome and the reversed P. patens genome; (B) vertebrate proteins and reversed plant proteins. The dashed line is the observed number of alignments, and the solid line is the expected number for random sequences. (C) One of the alignments between A. thaliana (upper) and reversed P. patens (lower), with masked letters in lowercase.
References
-
- Spouge JL. Markov additive processes and repeats in sequences. J. Appl. Prob. 2007;44:514–527.
Publication types
MeSH terms
Substances
LinkOut - more resources
Full Text Sources
Other Literature Sources
