. 2011 Jul;28(7):1973-86.
doi: 10.1093/molbev/msq311. Epub 2010 Nov 25.

Plasmodium falciparum genetic diversity maintained and amplified over 5 years of a low transmission endemic in the Peruvian Amazon

Affiliations

Plasmodium falciparum genetic diversity maintained and amplified over 5 years of a low transmission endemic in the Peruvian Amazon

Oralee H Branch et al. Mol Biol Evol. 2011 Jul.

Abstract

Plasmodium falciparum entered into the Peruvian Amazon in 1994, sparking an epidemic between 1995 and 1998. Since 2000, there has been sustained low P. falciparum transmission. The Malaria Immunology and Genetics in the Amazon project has longitudinally followed members of the community of Zungarococha (N = 1,945, 4 villages) with active household and health center-based visits each year since 2003. We examined parasite population structure and traced the parasite genetic diversity temporally and spatially. We genotyped infections over 5 years (2003-2007) using 14 microsatellite (MS) markers scattered across ten different chromosomes. Despite low transmission, there was considerable genetic diversity, which we compared with other geographic regions. We detected 182 different haplotypes from 302 parasites in 217 infections. Structure v2.2 identified five clusters (subpopulations) of phylogenetically related clones. To consider genetic diversity on a more detailed level, we defined haplotype families (hapfams) by grouping haplotypes with three or less loci differences. We identified 34 different hapfams identified. The F(st) statistic and heterozygosity analysis showed the five clusters were maintained in each village throughout this time. A minimum spanning network (MSN), stratified by the year of detection, showed that haplotypes within hapfams had allele differences and haplotypes within a cluster definition were more separated in the later years (2006-2007). We modeled hapfam detection and loss, accounting for sample size and stochastic fluctuations in frequencies overtime. Principle component analysis of genetic variation revealed patterns of genetic structure with time rather than village. The population structure, genetic diversity, appearance/disappearance of the different haplotypes from 2003 to 2007 provides a genome-wide "real-time" perspective of P. falciparum parasites in a low transmission region.


Figures

F<sc>IG</sc>. 1.
FIG. 1.
Global perspective of the mean number of alleles per locus versus the mean expected heterozygosity. The mean number of alleles per locus is represented by the dark gray bars measured on the primary y axis, and the mean expected heterozygosity (He) is represented by the light gray squares measured on the secondary y axis (error bars indicated standard error of the mean). On the x axis are locations of studies that have also examined PLD by utilizing microsatellite markers. Some studies are missing microsatellite markers that were reported in other studies (including ours), but this is simply an adaptation from what has been previously reported on a global perspective. As well, some studies report observed heterozygosity (Ho) rather than He but are just described synonymously. See table 3 for references.
F<sc>IG</sc>. 2.
FIG. 2.
Minimum spanning network of parasites collected in 2003–2005 (A) and 2006–2007 (B). The MS haplotype is shown with its cluster and hapfam characterization. The size of the circle reflects the frequency of the given haplotype in the MSN (A and B, separately). Haplotypes with different in less than 3 MS markers were defined as the same hapfam. There were 34 hapfams, and each haplotype is indicated by its hapfam (numbered 1–34). Colored circles represent clusters (1–5) as classified by Structure v2.2: orange = cluster 1, light blue = cluster 2, purple = cluster 3, green = cluster 4, and magenta = cluster 5. The clusters and hapfams generally agreed, particularly in 2003–2005. In 2006–2007, despite the lower number of infections, the genetic differentiation between haplotypes tended to increase (overall area similar in A and B; length of lines longer in B).
F<sc>IG</sc>. 3
FIG. 3
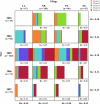
(a, b) Bar plot of clustered infections examined by village–year. Each of the five horizontal x axes represent the year that infections were detected, whereas the location of the infection by village, in which the infection was detected, intersects in four locations on the y axes. Where each village intersects with a corresponding year is referred to as a village–year, indicative of the infections detected in a particular village during a particular year. Individual infections are identified by gray tick marks along the corresponding year x axis. Colored bars represent clusters (1–5) as classified by Structure v2.2: orange = cluster 1, light blue = cluster 2, purple = cluster 3, green = cluster 4, and magenta = cluster 5. The overall He values are shown to the right for each study–year plotted and individual villages along the bottom most x axis. Individual village–year He values are shown beneath the infections reported during each respective village–year. Incomplete gaps within village–years indicate a lack of infections detected during that village–year.
F<sc>IG</sc>. 4.
FIG. 4.
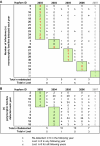
(A, B) Detection, redetection, and loss of monomorphic versus polymorphic hapfams over time. Hapfams are represented within green boxes at time of entry. The monomorphic hapfams are shown in the top panel (A) and the polymorphic below (B) with the name of the hapfam (numbered 1–34). In both monomorphic and polymorphic hapfams, there can be different haplotypes in each hapfam. Hapfams are called the same if ≤3 MS loci makers are different. Therefore, even in monomorphic hapfams, mutations can occur. We report the number of individuals in hapfams (n) for years 2003–2006 was used to compute parameters to estimate the redetection probabilities (see table 4).
F<sc>IG</sc>. 5
FIG. 5
(A, B) Graphic representation of the first two principle components for 206 individual infections genotyped with 14 microsatellites markers. Color code shows subgroups of infections partitioned (A) by year of sampling and (B) by villages. The level of genetic variation detected is more influenced by the year of collection, than the village of collection.

References

    1. Anderson TJ, Haubold B, Williams JT, et al. (16 co-authors) Microsatellite markers reveal a spectrum of population structures in the malaria parasite Plasmodium falciparum. Mol Biol Evol. 2000;17:1467–1482. - PubMed
    1. Aramburu Guarda J, Ramal Asayag C, Witzig R. Malaria reemergence in the Peruvian Amazon region. Emerg Infect Dis. 1999;5:209–215. - PMC - PubMed
    1. Bogreau H, Renaud F, Bouchiba H, et al. (15 co-authors) Genetic diversity and structure of African Plasmodium falciparum populations in urban and rural areas. Am J Trop Med Hyg. 2006;74:953–959. - PubMed
    1. Bonizzoni M, Afrane Y, Baliraine FN, Amenya DA, Githeko AK, Yan G. Genetic structure of Plasmodium falciparum populations between lowland and highland sites and antimalarial drug resistance in Western Kenya. Infect Genet Evol. 2009;9:806–812. - PMC - PubMed
    1. Branch O, Casapia WM, Gamboa DV, Hernandez JN, Alava FF, Roncal N, Alvarez E, Perez EJ, Gotuzzo E. Clustered local transmission and asymptomatic Plasmodium falciparum and Plasmodium vivax malaria infections in a recently emerged, hypoendemic Peruvian Amazon community. Malar J. 2005;4:27. - PMC - PubMed

Publication types