. 2010 Nov;128(5):3079-87.
doi: 10.1121/1.3493430.

An investigation of the relation between sibilant production and somatosensory and auditory acuity

Affiliations

An investigation of the relation between sibilant production and somatosensory and auditory acuity

Satrajit S Ghosh et al. J Acoust Soc Am. 2010 Nov.

Abstract

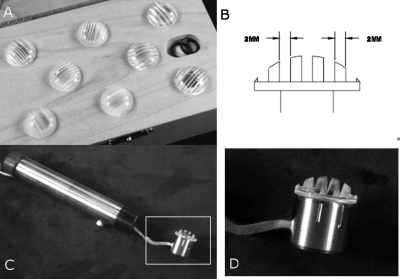
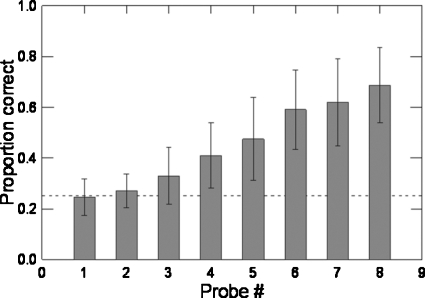
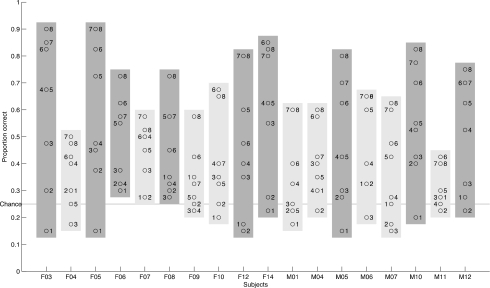
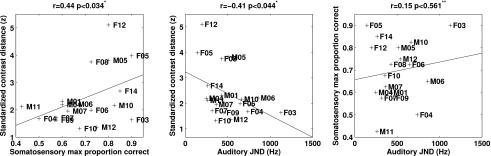
The relation between auditory acuity, somatosensory acuity and the magnitude of produced sibilant contrast was investigated with data from 18 participants. To measure auditory acuity, stimuli from a synthetic sibilant continuum ([s]-[ʃ]) were used in a four-interval, two-alternative forced choice adaptive-staircase discrimination task. To measure somatosensory acuity, small plastic domes with grooves of different spacing were pressed against each participant's tongue tip and the participant was asked to identify one of four possible orientations of the grooves. Sibilant contrast magnitudes were estimated from productions of the words 'said,' 'shed,' 'sid,' and 'shid'. Multiple linear regression revealed a significant relation indicating that a combination of somatosensory and auditory acuity measures predicts produced acoustic contrast. When the participants were divided into high- and low-acuity groups based on their median somatosensory and auditory acuity measures, separate ANOVA analyses with sibilant contrast as the dependent variable yielded a significant main effect for each acuity group. These results provide evidence that sibilant productions have auditory as well as somatosensory goals and are consistent with prior results and the theoretical framework underlying the DIVA model of speech production.


Figures

Figure 1
Figure 1
JVP Domes and custom probe. (a) The set of 8 domes used in the study. (b) Grid spacing on one dome. (c) Custom holder used to apply pressure. The strain gauges are inside the handle and are not visible. (d) Magnified image of the region marked by the white box in (c).
Figure 2
Figure 2
Mean and standard deviation of the proportion correct for each probe averaged across all participants. Chance (0.25) performance (dotted line) was observed for probes with finest grids (#1, #2).
Figure 3
Figure 3
Proportion correct for every participant and probe (identified by numbers). Most participants had difficulty with probes 1 and 2. All participants were above chance by probe #6. Somatosensory acuity (SAPC) was defined as the best performance (highest proportion correct) across probes for each participant (top open circle in each column). Median split groups are shown in different shades (lighter shade—lower acuity, darker shade—higher acuity).
Figure 4
Figure 4
Correlations between standardized contrast distance and somatosensory maximum proportion correct (left), between standardized contrast distance and auditory JND (middle) and between somatosensory maximum proportion correct and auditory JND (right). ( *-one-tailed, **-two-tailed).
Figure 5
Figure 5
Differences in 3-D contrast distance for said∕shed and sid∕shid as a function of group based on acuity and vowels (‘eh’ as in said, ‘ih’ as in sid; Groups-b: SomGrp=1, AudGrp=1; s: SomGrp=1, AudGrp=0; p: SomGrp=0, AudGrp=1; n: SomGrp=0, AudGrp=0; 1 indicates higher than median, and 0 indicates lower than median).

References

    1. Cai, S., Boucek, M., Ghosh, S. S., Guenther, F. H., and Perkell, J. S. (2008). “A system for online dynamic perturbation of formant frequencies and results from perturbation of the mandarin triphthong ∕iau∕,” in Proceedings of the 8th International Seminar on Speech Production, Strasbourg, France, pp. 65–68.
    1. Forrest, K., Weismer, G., Milenkovic, P., and Dougall, R. N. (1988). “Statistical analysis of word-initial voiceless obstruents: Preliminary data,” J. Acoust. Soc. Am. JASMAN 84, 115–123.10.1121/1.396977 - DOI - PubMed
    1. Gracco, V. L., and Abbs, J. H. (1989). “Sensorimotor characteristics of speech motor sequences,” Exp. Brain Res. EXBRAP 75, 586–598.10.1007/BF00249910 - DOI - PubMed
    1. Guenther, F. H. (1994). “A neural network model of speech acquisition and motor equivalent speech production,” Biol. Cybern. BICYAF 72, 43–53.10.1007/BF00206237 - DOI - PubMed
    1. Guenther, F. H. (1995). “Speech sound acquisition, coarticulation, and rate effects in a neural network model of speech production,” Psychol. Rev. PSRVAX 102, 594–621.10.1037/0033-295X.102.3.594 - DOI - PubMed

Publication types