

Phenotypic plasticity and genetic adaptation to high-altitude hypoxia in vertebrates
- PMID: 21112992
- PMCID: PMC2992463
- DOI: 10.1242/jeb.048181
Phenotypic plasticity and genetic adaptation to high-altitude hypoxia in vertebrates
Abstract
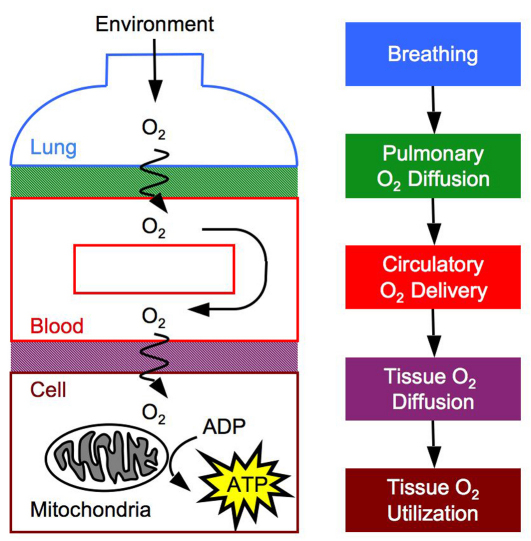
High-altitude environments provide ideal testing grounds for investigations of mechanism and process in physiological adaptation. In vertebrates, much of our understanding of the acclimatization response to high-altitude hypoxia derives from studies of animal species that are native to lowland environments. Such studies can indicate whether phenotypic plasticity will generally facilitate or impede adaptation to high altitude. Here, we review general mechanisms of physiological acclimatization and genetic adaptation to high-altitude hypoxia in birds and mammals. We evaluate whether the acclimatization response to environmental hypoxia can be regarded generally as a mechanism of adaptive phenotypic plasticity, or whether it might sometimes represent a misdirected response that acts as a hindrance to genetic adaptation. In cases in which the acclimatization response to hypoxia is maladaptive, selection will favor an attenuation of the induced phenotypic change. This can result in a form of cryptic adaptive evolution in which phenotypic similarity between high- and low-altitude populations is attributable to directional selection on genetically based trait variation that offsets environmentally induced changes. The blunted erythropoietic and pulmonary vasoconstriction responses to hypoxia in Tibetan humans and numerous high-altitude birds and mammals provide possible examples of this phenomenon. When lowland animals colonize high-altitude environments, adaptive phenotypic plasticity can mitigate the costs of selection, thereby enhancing prospects for population establishment and persistence. By contrast, maladaptive plasticity has the opposite effect. Thus, insights into the acclimatization response of lowland animals to high-altitude hypoxia can provide a basis for predicting how altitudinal range limits might shift in response to climate change.
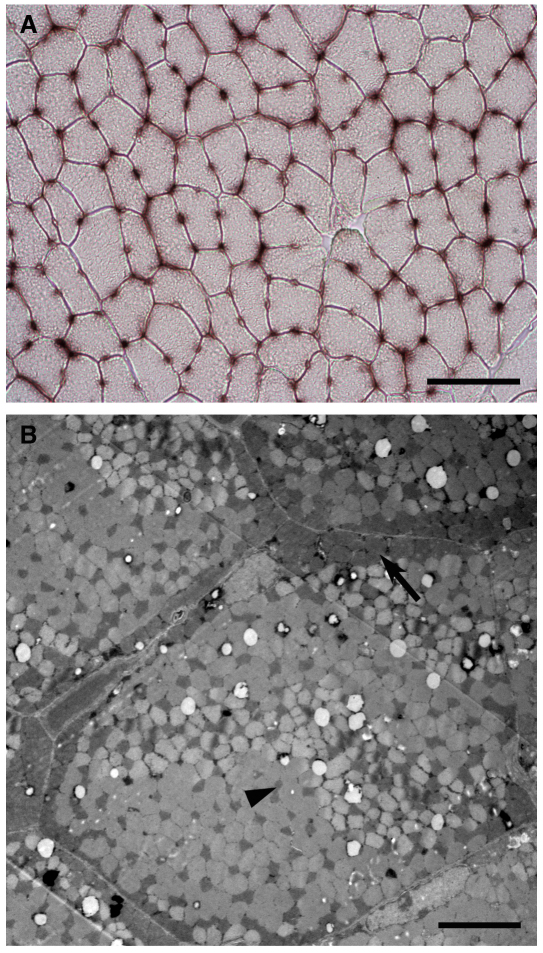
Figures
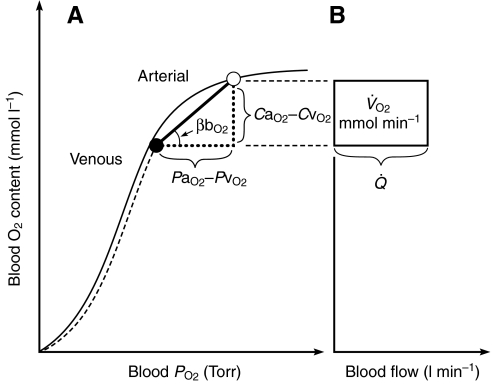
 denotes cardiac output, and
  denotes the rate of O2 consumption. (B) The area of the rectangle is proportional to total O2 consumption, which can be enhanced by increasing and/or by increasing the βbO2. Increases in the βbO2 produce a corresponding increase in CaO2–CvO2 through shifts in the shape or position of the O2-equilibrium curve.
References
-
- Appenzeller O., Minko T., Qualis C., Pozharov V., Gamboa J., Wang Y. (2006). Gene expression, autonomic function and chronic hypoxia: lessons from the Andes. Clin. Auton. Res. 16, 217-222 - PubMed
-
- Beall C. M. (2006). Andean, Tibetan, and Ethiopian patterns of adaptation to high-altitude hypoxia. Integr. Comp. Biol. 46, 18-24 - PubMed
-
- Beall C. M., Reichsman A. B. (1984). Hemoglobin levels in a Himalayan high altitude population. Am. J. Phys. Anthropol. 63, 301-306 - PubMed
Publication types
MeSH terms
Substances
Grants and funding
LinkOut - more resources
Full Text Sources
