

Statistical treatment of photon/electron counting: extending the linear dynamic range from the dark count rate to saturation
- PMID: 21114249
- PMCID: PMC3025609
- DOI: 10.1021/ac102219c
Statistical treatment of photon/electron counting: extending the linear dynamic range from the dark count rate to saturation
Abstract
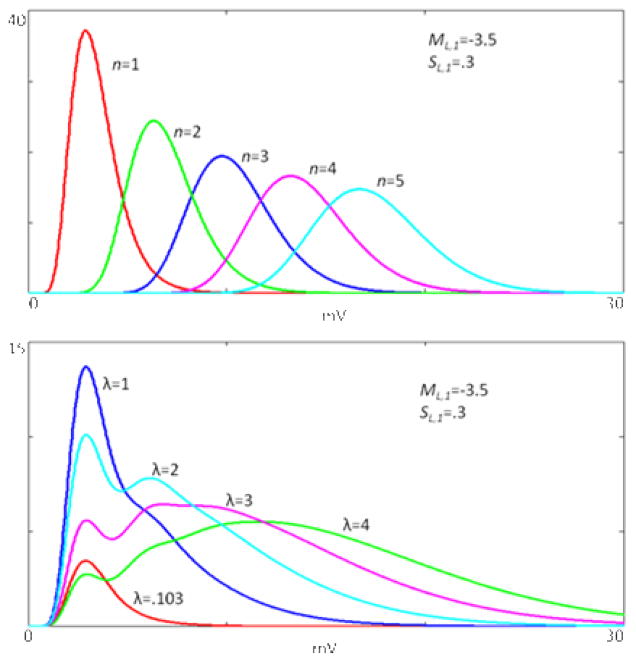
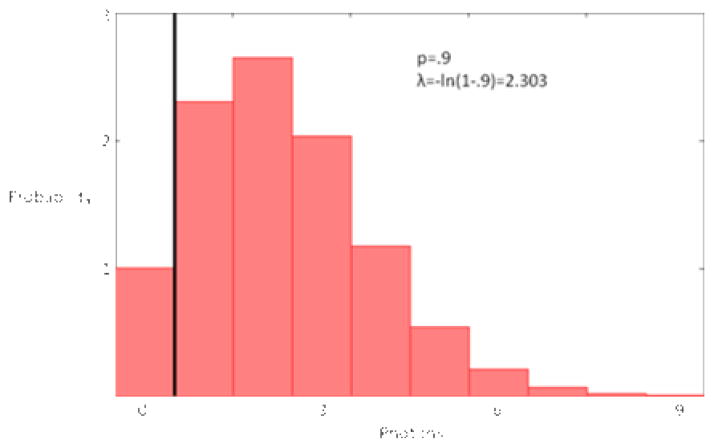
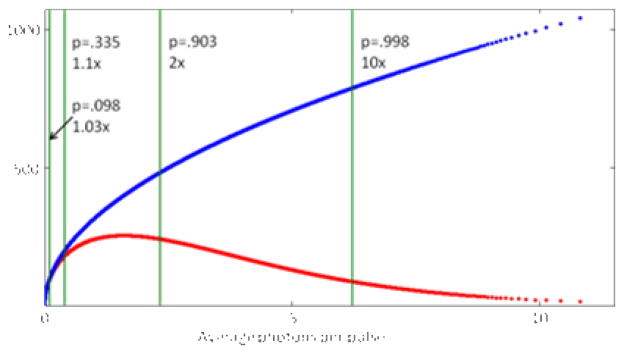
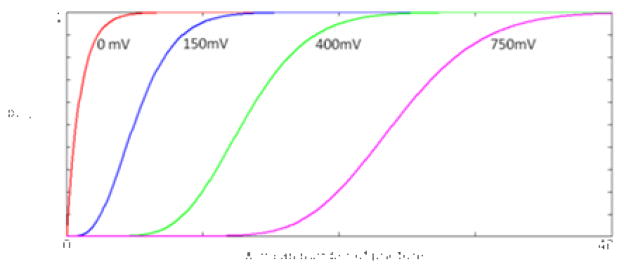
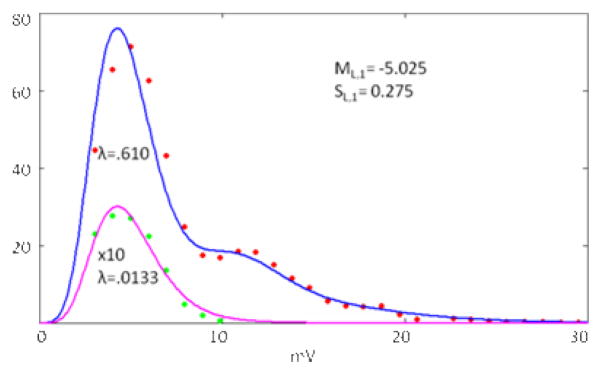
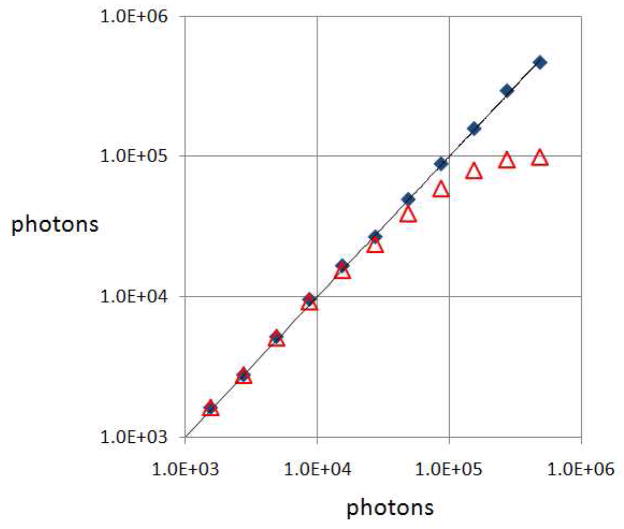
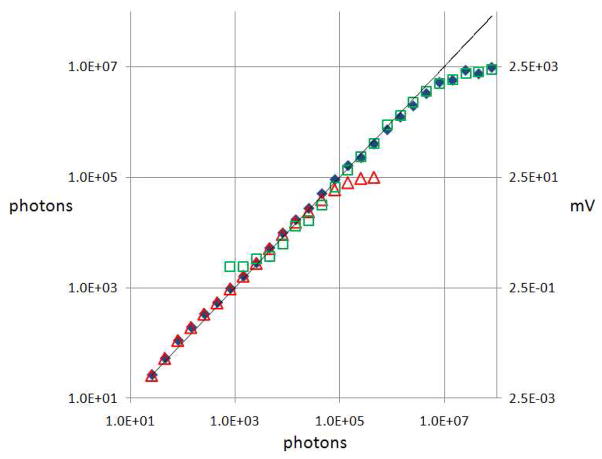
An experimentally simple photon counting method is demonstrated providing 7 orders of magnitude in linear dynamic range (LDR) for a single photomultiplier tube (PMT) detector. In conventional photon/electron counting methods, the linear range is dictated by the agreement between the binomially distributed measurement of counted events and the underlying Poisson distribution of photons/electrons. By explicitly considering the log-normal probability distribution in voltage transients as a function of the number of photons present and the Poisson distribution of photons, observed counts for a given threshold can be related to the mean number of photons well beyond the conventional limit. Analytical expressions are derived relating counts and photons that extend the linear range to an average of ∼11 photons arriving simultaneously with a single threshold. These expressions can be evaluated numerically for multiple thresholds extending the linear range to the saturation point of the PMT. The peak voltage distributions are experimentally shown to follow a Poisson weighted sum of log-normal distributions that can all be derived from the single photoelectron voltage peak-height distribution. The LDR that results from this method is compared to conventional single photon counting (SPC) and to signal averaging by analog to digital conversion (ADC).
Figures
Similar articles
-
Statistical connection of binomial photon counting and photon averaging in high dynamic range beam-scanning microscopy.Opt Express. 2012 Apr 23;20(9):10406-15. doi: 10.1364/OE.20.010406. Opt Express. 2012. PMID: 22535131 Free PMC article.
-
Direct energy binning for photon counting detectors: Simulation study.Med Phys. 2024 Jan;51(1):70-79. doi: 10.1002/mp.16841. Epub 2023 Nov 27. Med Phys. 2024. PMID: 38011545 Free PMC article.
-
Photon counting statistics analysis of biophotons from hands.Indian J Exp Biol. 2003 May;41(5):446-51. Indian J Exp Biol. 2003. PMID: 15244266
-
Single-photon-counting detector for increased sensitivity in two-photon laser scanning microscopy.Opt Lett. 2008 Dec 15;33(24):2895-7. doi: 10.1364/ol.33.002895. Opt Lett. 2008. PMID: 19079484 Free PMC article.
-
Role of non-linear optics and multiple photon absorbance in enhancing sensitivity of enzyme-based chemical agent detectors.Methods. 2008 Sep;46(1):18-24. doi: 10.1016/j.ymeth.2008.05.003. Epub 2008 Jun 16. Methods. 2008. PMID: 18559258 Review.
Cited by
-
Statistical connection of binomial photon counting and photon averaging in high dynamic range beam-scanning microscopy.Opt Express. 2012 Apr 23;20(9):10406-15. doi: 10.1364/OE.20.010406. Opt Express. 2012. PMID: 22535131 Free PMC article.
-
Real-time dynamic range and signal to noise enhancement in beam-scanning microscopy by integration of sensor characteristics, data acquisition hardware, and statistical methods.Proc SPIE Int Soc Opt Eng. 2013 Feb 14;8657:86570E. doi: 10.1117/12.2008607. Proc SPIE Int Soc Opt Eng. 2013. PMID: 24817799 Free PMC article.
-
High frame-rate multichannel beam-scanning microscopy based on Lissajous trajectories.Opt Express. 2014 Oct 6;22(20):24224-34. doi: 10.1364/OE.22.024224. Opt Express. 2014. PMID: 25321997 Free PMC article.
-
Digital deconvolution filter derived from linear discriminant analysis and application for multiphoton fluorescence microscopy.Anal Chem. 2014 Apr 1;86(7):3508-16. doi: 10.1021/ac404150d. Epub 2014 Mar 11. Anal Chem. 2014. PMID: 24559143 Free PMC article.
-
Real-time high dynamic range laser scanning microscopy.Nat Commun. 2016 Apr 1;7:11077. doi: 10.1038/ncomms11077. Nat Commun. 2016. PMID: 27032979 Free PMC article.
References
-
- Ingle JD, Crouch SR. CRITICAL COMPARISON OF PHOTON COUNTING AND DIRECT-CURRENT MEASUREMENT TECHNIQUES FOR QUANTITATIVE SPECTROMETRIC METHODS. Analytical Chemistry. 1972;44:785. - PubMed
-
- Williamson JA, Kendalltobias MW, Buhl M, Seibert M. STATISTICAL EVALUATION OF DEAD TIME EFFECTS AND PULSE PILEUP IN FAST PHOTON-COUNTING - INTRODUCTION OF THE SEQUENTIAL MODEL. Analytical Chemistry. 1988;60:2198–2203.
-
- Darland EJ, Leroi GE, Enke CG. PULSE (PHOTON) COUNTING - DETERMINATION OF OPTIMUM MEASUREMENT SYSTEM PARAMETERS. Analytical Chemistry. 1979;51:240–245.
-
- Darland EJ, Leroi GE, Enke CG. MAXIMUM EFFICIENCY PULSE COUNTING IN COMPUTERIZED INSTRUMENTATION. Analytical Chemistry. 1980;52:714–723.
-
- Hayes JM, Schoeller DA. HIGH PRECISION PULSE COUNTING - LIMITATIONS AND OPTIMAL CONDITIONS. Analytical Chemistry. 1977;49:306–311.
Publication types
MeSH terms
Grants and funding
LinkOut - more resources
Full Text Sources
Other Literature Sources
