. 2011 Jan 2;10(1):102-10.
doi: 10.1016/j.dnarep.2010.10.004. Epub 2010 Nov 5.

Chromosome integrity at a double-strand break requires exonuclease 1 and MRX

Affiliations

Chromosome integrity at a double-strand break requires exonuclease 1 and MRX

Wataru Nakai et al. DNA Repair (Amst). .

Abstract

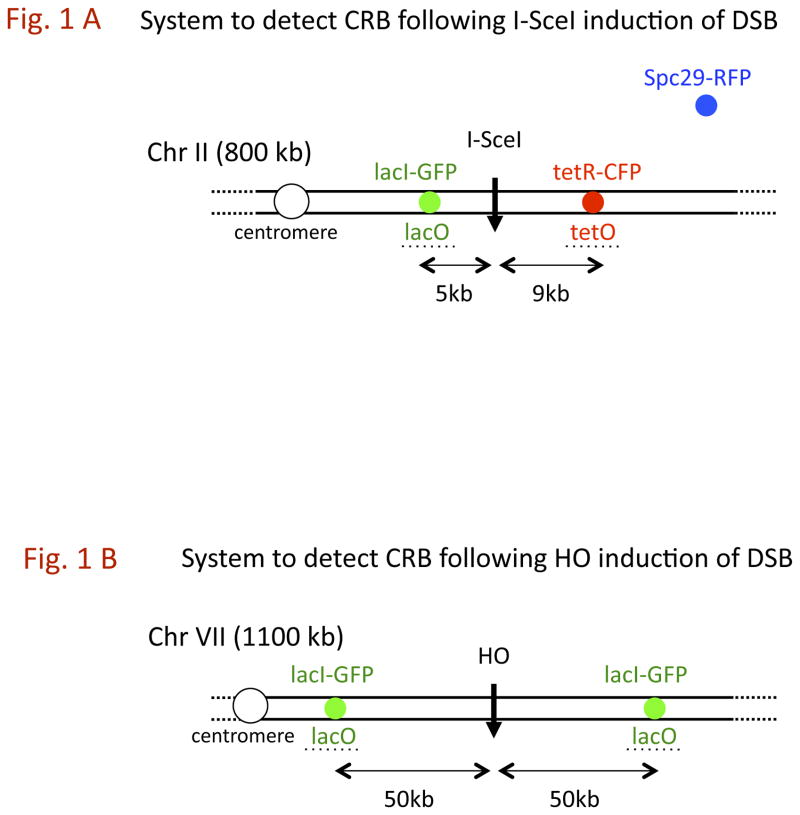
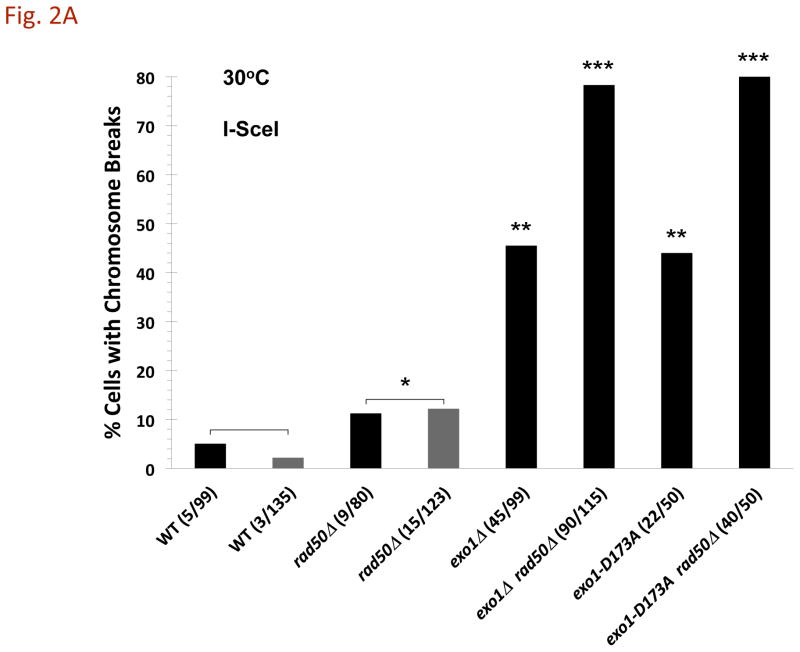
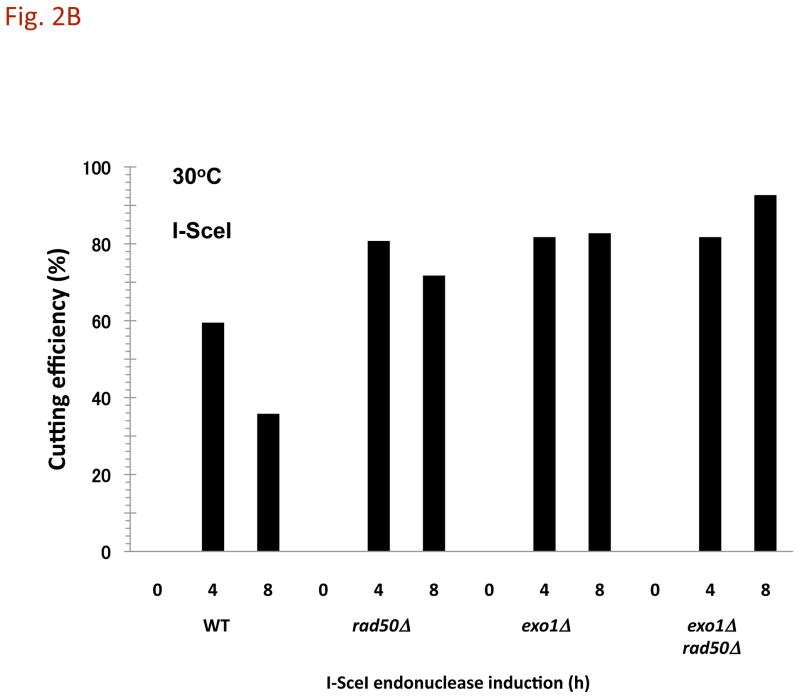
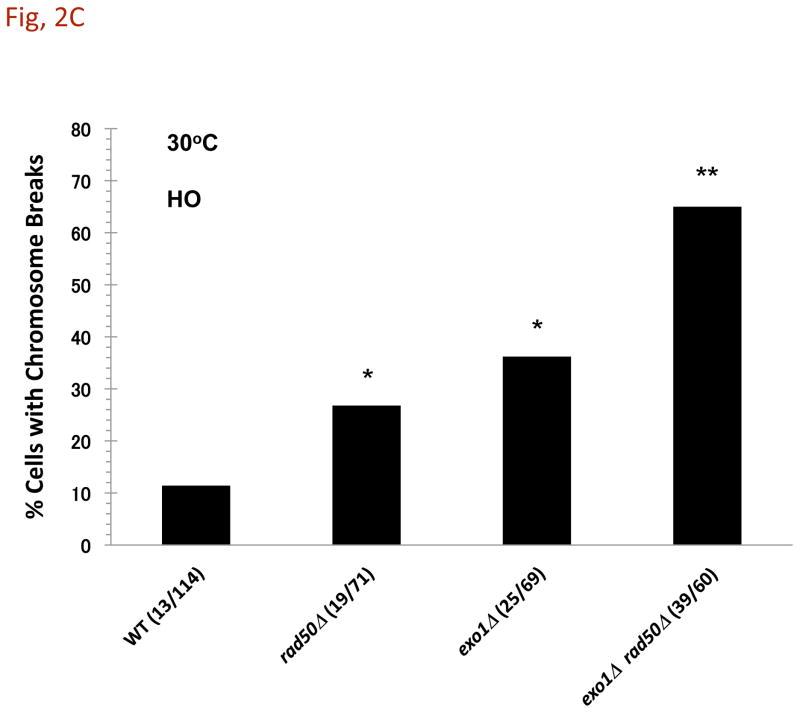
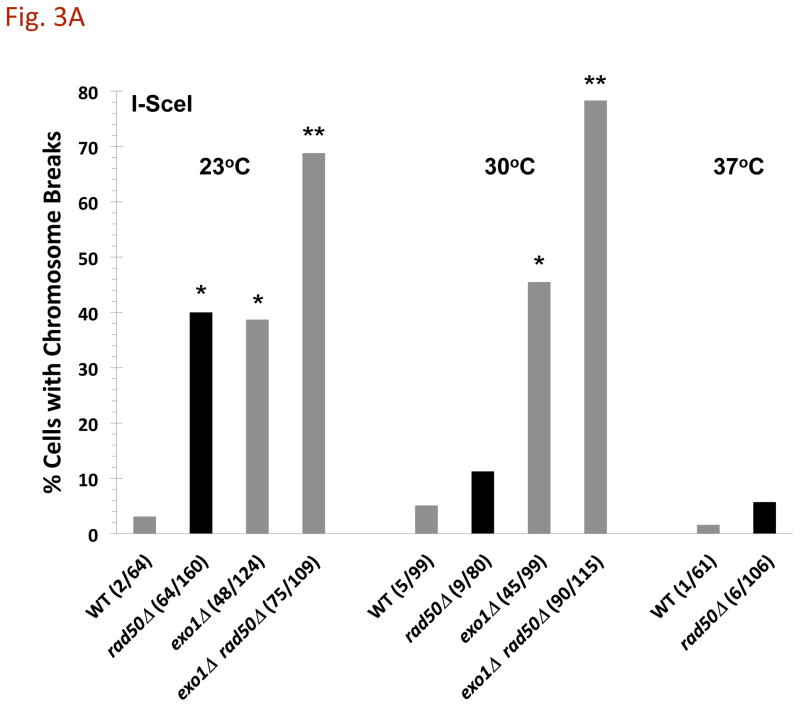
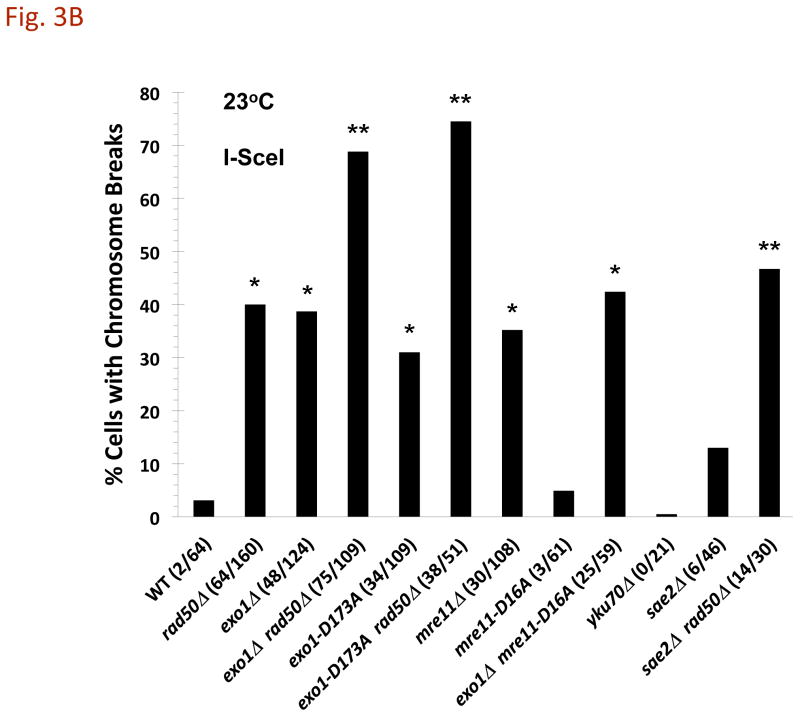
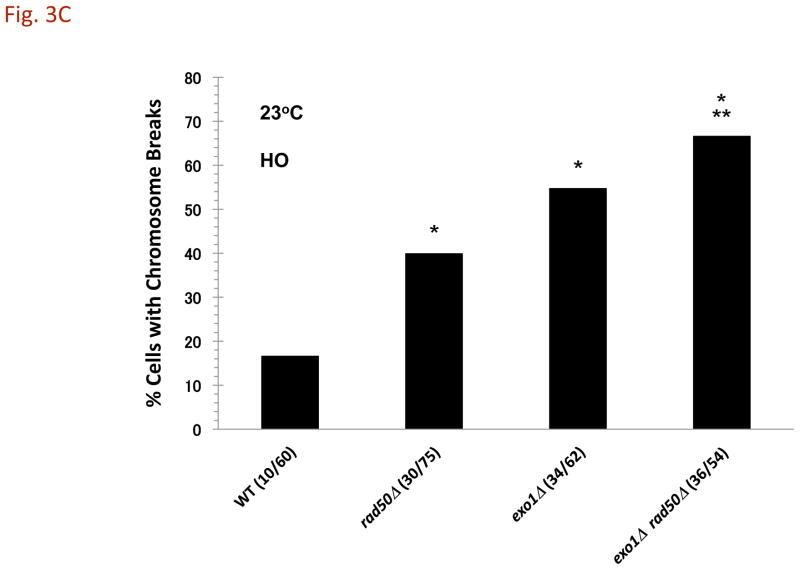
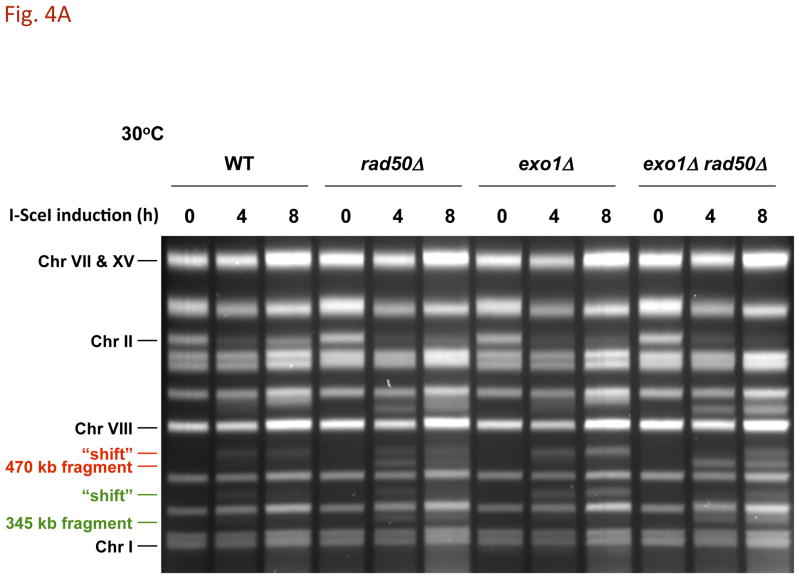
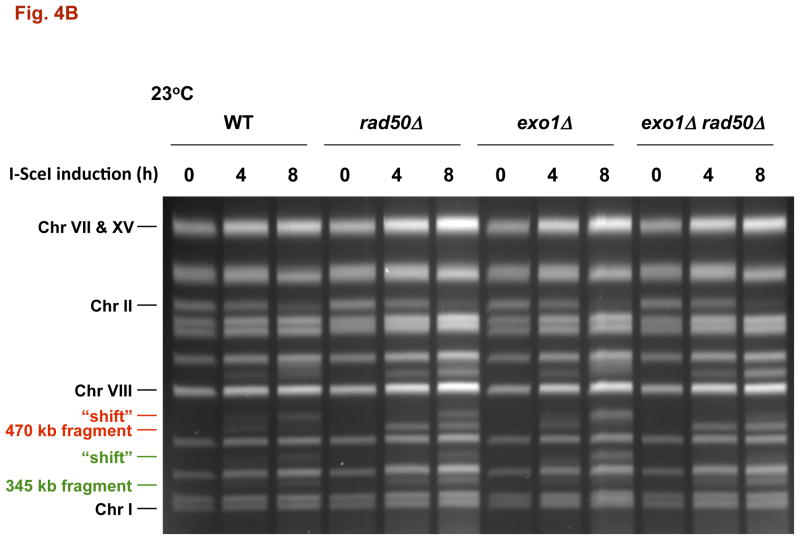
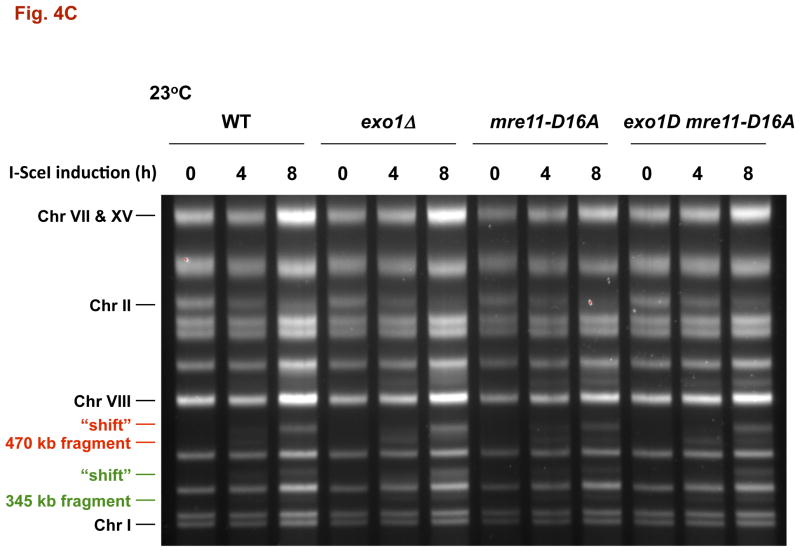
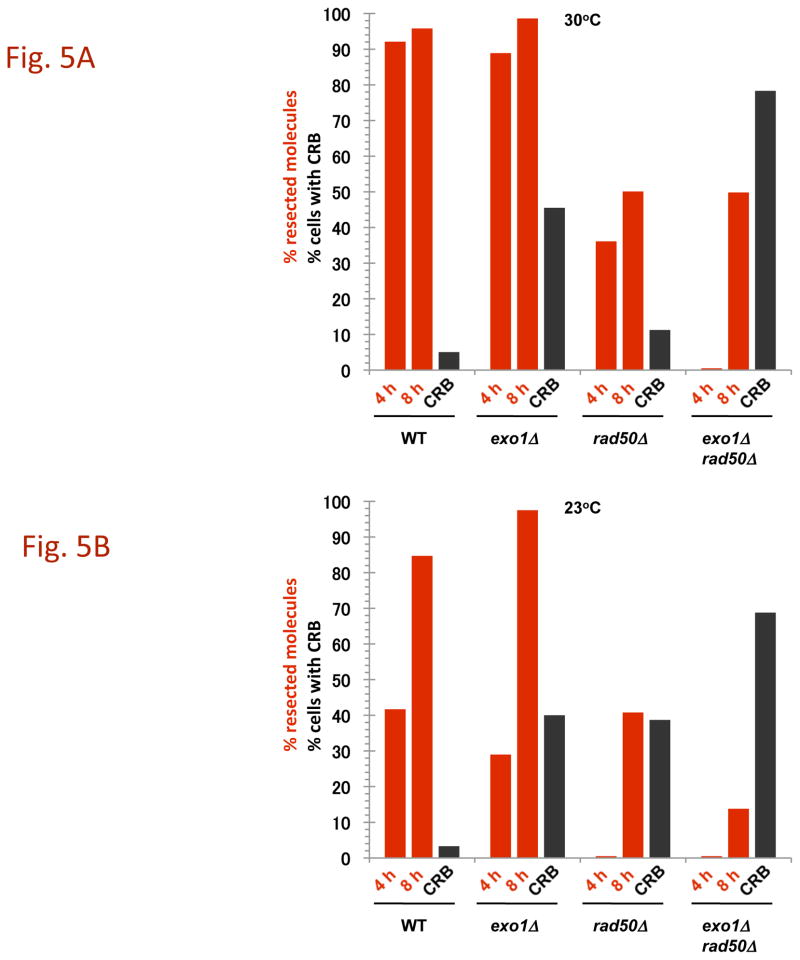
The continuity of duplex DNA is generally considered a prerequisite for chromosome continuity. However, as previously shown in yeast as well as human cells, the introduction of a double-strand break (DSB) does not generate a chromosome break (CRB) in yeast or human cells. The transition from DSB to CRB was found to be under limited control by the tethering function of the RAD50/MRE11/XRS2 (MRX) complex. Using a system for differential fluorescent marking of both sides of an endonuclease-induced DSB in single cells, we found that nearly all DSBs are converted to CRBs in cells lacking both exonuclease 1 (EXO1) activity and MRX complex. Thus, it appears that some feature of exonuclease processing or resection at a DSB is critical for maintaining broken chromosome ends in close proximity. In addition, we discovered a thermal sensitive (cold) component to CRB formation in an MRX mutant that has implications for chromosome end mobility and/or end-processing.


Figures

Fig. 1
Fig. 1. Systems for the detection of a CRB induced by site-specific DSBs using nearby probes
A) I-SceI system (adapted from [3]): A DSB is generated by I-SceI endonuclease which is under control of a GAL1 promoter. Multiple repeat sequences of lacO which binds lacI-GFP and tetO which binds tetR-CFP are 4.7 kb and 9.2 kb, respectively, from the DSB site. The spindle pole body is identified by Spc29-RFP chimeric protein. A CRB is identified by separation of > 0.8 μm separation of the GFP and CFP spots. B) HO-system (adapted from [4]): Two multiple repeat sequences of lacO, which binds lacI-GFP, are located 50 kb from an HO-endonuclease site. The endonuclease is under the control of a GAL1 promoter.
Fig. 2
Fig. 2. A DSB to CRB transition is primarily determined by exonuclease 1 and MRX following induction of a DSB
Cells were grown in YEPD overnight, transferred in YEP lactate overnight, and resuspended in synthetic medium with galactose at 30°C as described in the Material and Methods. A) I-SceI induced CRBs. Presented is the % of large budded cells with separated (> 0.8 μm) lacI-GFP and tetR-CFP spots after 8 h I-SceI induction. Previous results [3] are included (gray bars). The exo1Δ mutant exhibited a high frequency of CRBs after DSB induction, reaching ~40% in large budded cells. The frequency of CRBs was substantially greater in exo1Δ rad50Δ double mutant. Presented in parenthesis are the numbers of cells with CRBs/total cells examined. While the present rad50Δ vs WT results are not statistically different, the previous results [3] were at the p = 0.01 level. The combination of results from the two sets of data (indicated by brackets) are significant at the p = 0.01 level (see Material and Methods). The “**” indicates significant difference from the WT at p < 0.01 level. The “***” indicates significant difference from the single mutant at p < 0.01 level. B) I-SceI DSB cutting efficiency. DNA-plugs were prepared from imaging samples at 0, 4, and 8 h, and chromosomes were separated by PFGE. Chr II and digested fragments were detected by Southern blotting with probes as described in the Material and Methods. The intensity of bands was determined using ImageQuant software, and cutting efficiency was determined by the ratio of the centric and acentric fragments/total Chr II. C) HO-induced CRBs. After HO-induction for 6 h, the % of large budded cells with two lacI-GFP spots was determined. Assuming 100% cutting, the efficiency of DSB to CRB transition is 11% in the WT strain, 27% in rad50Δ, 36% in exo1Δ and 65% in exo1Δ rad50Δ. Because the HO system uses a single color, these results may include sister chromatid separation. Presented in parentheses are the numbers of cells with CRBs/total cells examined. The “*” indicates significant difference from the WT at p < 0.01 level. The “**” indicates significant difference from the single mutant at p < 0.01 level.
Fig. 3
Fig. 3. Affect of temperature on the appearance of DSB-induced CRBs
Cells were grown at 30°C, and shifted to 23°C, 30°C, or 37°C during I-SceI induction. A) Increased CRBs for rad50Δ mutants but not exo1Δ at reduced temperature. Transition from a DSB to a CRB was 5% in WT and 12% in rad50Δ at 30°C. The I-SceI induction was for 8 hr. The “*” indicates significant difference from the WT at p < 0.01 level. The “**” indicates significant difference from the single mutant at p < 0.01 level. Comparisons are for the 23°C and the 30°C sets of data. B) CRB induction at 23°C in various mutants after I-SceI induction for 8 hr. The “*” indicates significant difference from the WT at p < 0.01 level. For exo1Δ mre11-16A the single asterisk indicates significant difference from the WT and the mre11-16A mutant. The “**” indicates significant difference from the single mutant at p < 0.01 level (for sae2Δ rad50Δ, the comparison is with the sae2Δ mutant). C) HO-induced CRBs at 23°C. Cells were grown at 30°C and shifted to 23°C during HO induction. The cells with CRBs after HO induction for 6 h were identified as containing two or more GFP spots. The “*” indicates significant difference from the WT at p < 0.01 level. The “**” indicates significant difference from the single rad50Δ mutant at p < 0.01 level. Presented in parenthesis are the numbers of cells with CRBs/total cells examined.
Fig. 4
Fig. 4. DSB resection in MRX and exonuclease 1 mutants as determined by pulse-field shift
DNA-plugs were prepared from samples used for imaging and chromosomes were separated by PFGE; gels were stained with SYBR Gold. I-SceI induction resulted in cutting of the 815 kb Chr II into 470 kb and 345 kb fragments. With time, resection leads to a shift in these bands to slower mobilities [10]. A) PFGE-shift following incubation at 30 °C. B) and C) PFGE-shift following incubation at 23 °C of various mutants. Most chromosome fragments were shifted in the mre11-D16A mutant and exo1Δ mre11-D16A double mutant.
Fig. 5
Fig. 5. Summary of resection and CRBs at 30°C and 23 °C
The percentages of molecules that were resected were determined from PFGE images such as those described in Fig. 4 and are presented as red bars. The images were analyzed using KODAK MI software for the amount of broken 470 kb molecules that were unshifted or shifted (material above the 470 kb band). The black bars correspond to percentages of large budded cells that contain CRBs. The I-SceI induction was for 8 h.
Fig. 6
Fig. 6. Appearance of both CFP and GFP “spots” following DSB induction
After I-SceI induction at 30°C or 23°C for 8 h, the percentage of large budded cells containing both lacI-GFP and tetR-CFP fluorescent markers was determined. The “WT no DSB” strain lacks an I-SceI recognition sequence on chromosome II. The “*” indicates significant difference from the WT and rad50Δ at p < 0.01 level. The “**” indicates significant difference from the exo1Δ and the exo1Δ rad50Δ mutants at the p < 0.01 level. Presented in parentheses are the numbers of cells with both spots/total cells examined.

References

    1. Mills KD, Ferguson DO, Alt FW. The role of DNA breaks in genomic instability and tumorigenesis. Immunol Rev. 2003;194:77–95. - PubMed
    1. Albertson DG, Collins C, McCormick F, Gray JW. Chromosome aberrations in solid tumors. Nat Genet. 2003;34:369–376. - PubMed
    1. Lobachev K, Vitriol E, Stemple J, Resnick MA, Bloom K. Chromosome fragmentation after induction of a double-strand break is an active process prevented by the RMX repair complex. Curr Biol. 2004;14:2107–2112. - PubMed
    1. Kaye JA, Melo JA, Cheung SK, Vaze MB, Haber JE, Toczyski DP. DNA breaks promote genomic instability by impeding proper chromosome segregation. Curr Biol. 2004;14:2096–2106. - PubMed
    1. Soutoglou E, Dorn JF, Sengupta K, Jasin M, Nussenzweig A, Ried T, Danuser G, Misteli T. Positional stability of single double-strand breaks in mammalian cells. Nat Cell Biol. 2007;9:675–682. - PMC - PubMed

Publication types

MeSH terms