

Synergistic induction of apoptosis by the Bcl-2 inhibitor ABT-737 and imatinib mesylate in gastrointestinal stromal tumor cells
- PMID: 21115411
- PMCID: PMC5528266
- DOI: 10.1016/j.molonc.2010.10.003
Synergistic induction of apoptosis by the Bcl-2 inhibitor ABT-737 and imatinib mesylate in gastrointestinal stromal tumor cells
Abstract
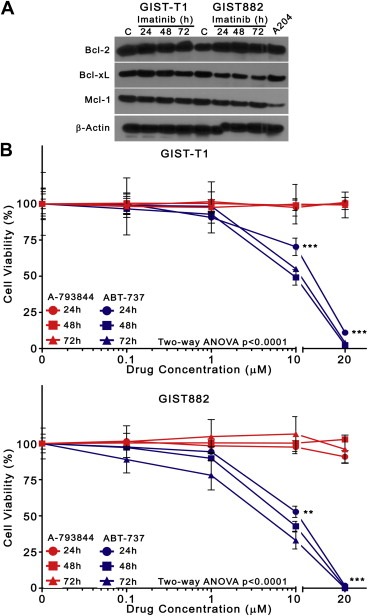
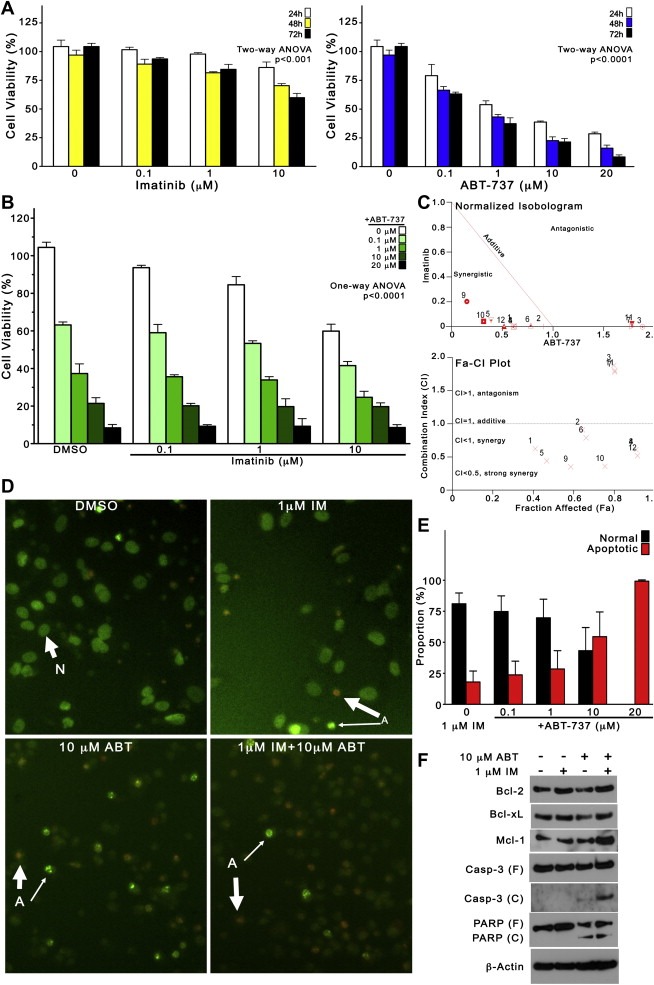
Background: Although imatinib mesylate has revolutionized the management of patients with gastrointestinal stromal tumor (GIST), resistance and progression almost inevitably develop with long-term monotherapy. To enhance imatinib-induced cytotoxicity and overcome imatinib-resistance in GIST cells, we examined the antitumor effects of the pro-apoptotic Bcl-2/Bcl-x(L) inhibitor ABT-737, alone and in combination with imatinib.
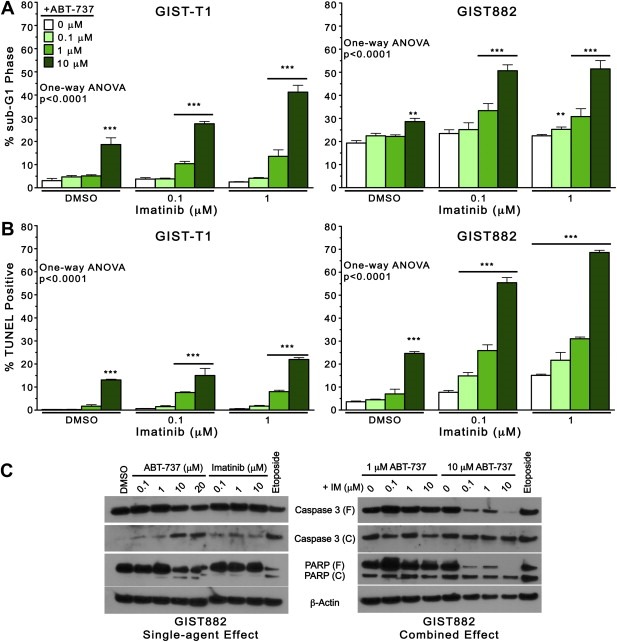
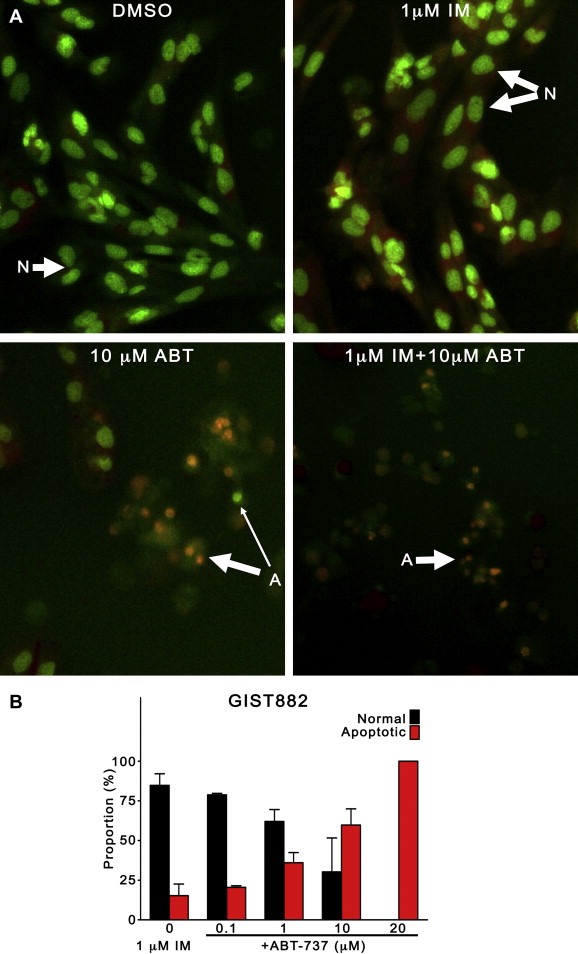
Methods: We treated imatinib-sensitive, GIST-T1 and GIST882, and imatinib-resistant cells with ABT-737 alone and with imatinib. We determined the anti-proliferative and apoptotic effects by cell viability assay, flow cytometric apoptosis and cell cycle analysis, immunoblotting, and nuclear morphology. Synergism was determined by isobologram analysis.
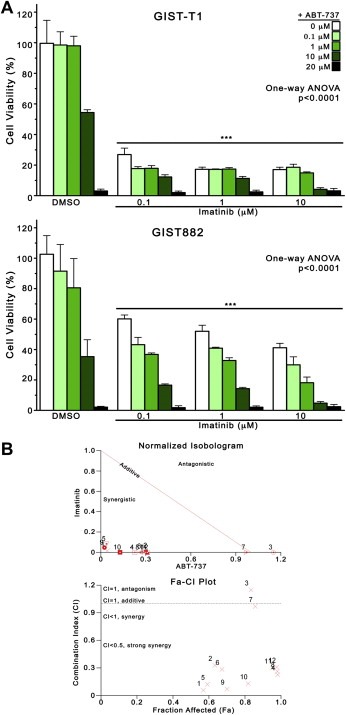
Results: The IC(50) of single-agent ABT-737 at 72 h was 10 μM in imatinib-sensitive GIST-T1 and GIST882 cells, and 1 μM in imatinib-resistant GIST48IM cells. ABT-737 and imatinib combined synergistically in a time- and dose-dependent manner to inhibit the proliferation and induce apoptosis of all GIST cells, as evidenced by cell viability and apoptosis assays, caspase activation, PARP cleavage, and morphologic changes. Isobologram analyses revealed strongly synergistic drug interactions, with combination indices <0.5 for most ABT-737/imatinib combinations. Thus, clinically relevant in vitro concentrations of ABT-737 have single-agent antitumor activity and are synergistic in combination with imatinib.
Conclusion: We provide the first preclinical evidence that Bcl-2/Bcl-x(L) inhibition with ABT-737 synergistically enhances imatinib-induced cytotoxicity via apoptosis, and that direct engagement of apoptotic cell death may be an effective approach to circumvent imatinib-resistance in GIST.
Published by Elsevier B.V.
Figures
Similar articles
-
ABT-737 increases tyrosine kinase inhibitor-induced apoptosis in chronic myeloid leukemia cells through XIAP downregulation and sensitizes CD34(+) CD38(-) population to imatinib.Exp Hematol. 2012 May;40(5):367-78.e2. doi: 10.1016/j.exphem.2012.01.004. Epub 2012 Jan 10. Exp Hematol. 2012. PMID: 22240609
-
[Bcl-2 inhibitor ABT-737 enhances the cisplatin-induced apoptosis in breast cancer T47D cells].Zhonghua Zhong Liu Za Zhi. 2011 Dec;33(12):891-5. Zhonghua Zhong Liu Za Zhi. 2011. PMID: 22340096 Chinese.
-
BH3 mimetic ABT-737 and a proteasome inhibitor synergistically kill melanomas through Noxa-dependent apoptosis.J Invest Dermatol. 2009 Apr;129(4):964-71. doi: 10.1038/jid.2008.327. Epub 2008 Nov 6. J Invest Dermatol. 2009. PMID: 18987671
-
γ-Secretase inhibition promotes cell death, Noxa upregulation, and sensitization to BH3 mimetic ABT-737 in human breast cancer cells.Breast Cancer Res. 2012 Jun 15;14(3):R96. doi: 10.1186/bcr3214. Breast Cancer Res. 2012. PMID: 22703841 Free PMC article.
-
Non-peptidic small molecule inhibitors against Bcl-2 for cancer therapy.J Cell Physiol. 2009 Jan;218(1):13-21. doi: 10.1002/jcp.21567. J Cell Physiol. 2009. PMID: 18767026 Free PMC article. Review.
Cited by
-
Antihelminthic benzimidazoles potentiate navitoclax (ABT-263) activity by inducing Noxa-dependent apoptosis in non-small cell lung cancer (NSCLC) cell lines.Cancer Cell Int. 2015 Feb 4;15(1):5. doi: 10.1186/s12935-014-0151-3. eCollection 2015. Cancer Cell Int. 2015. PMID: 25685063 Free PMC article.
-
Gastrointestinal stromal tumours: origin and molecular oncology.Nat Rev Cancer. 2011 Nov 17;11(12):865-78. doi: 10.1038/nrc3143. Nat Rev Cancer. 2011. PMID: 22089421 Review.
-
Comparison of in vitro antileukemic activity of obatoclax and ABT-737.Tumour Biol. 2016 Aug;37(8):10839-49. doi: 10.1007/s13277-016-4943-z. Epub 2016 Feb 15. Tumour Biol. 2016. PMID: 26880588 Free PMC article.
-
Gastrointestinal stromal tumor and its targeted therapeutics.Chin J Cancer. 2011 May;30(5):303-14. doi: 10.5732/cjc.011.10062. Chin J Cancer. 2011. PMID: 21527063 Free PMC article. Review.
-
Targeted polytherapy in small cell sarcoma and its association with doxorubicin.Mol Oncol. 2014 Dec;8(8):1458-68. doi: 10.1016/j.molonc.2014.05.016. Epub 2014 Jun 10. Mol Oncol. 2014. PMID: 24998445 Free PMC article.
References
-
- Bauer, S. , Yu, L.K. , 2006. Heat shock protein 90 inhibition in imatinib-resistant gastrointestinal stromal tumor. Cancer Res. 66, (18) 9153–9161. - PubMed
-
- Benjamin, R.S. , Debiec-Rychter, M. , 2009. Gastrointestinal stromal tumors II: medical oncology and tumor response assessment. Semin. Oncol. 36, (4) 302–311. - PubMed
-
- Blanke, C.D. , Demetri, G.D. , 2008. Long-term results from a randomized phase II trial of standard- versus higher-dose imatinib mesylate for patients with unresectable or metastatic gastrointestinal stromal tumors expressing KIT. J. Clin. Oncol. 26, (4) 620–625. - PubMed
-
- Blanke, C.D. , Rankin, C. , 2008. Phase III randomized, intergroup trial assessing imatinib mesylate at two dose levels in patients with unresectable or metastatic gastrointestinal stromal tumors expressing the kit receptor tyrosine kinase: S0033. J. Clin. Oncol. 26, (4) 626–632. - PubMed
Publication types
MeSH terms
Substances
Grants and funding
LinkOut - more resources
Full Text Sources
