. 2011 Feb 11;286(6):4783-95.
doi: 10.1074/jbc.M110.182733. Epub 2010 Nov 28.

E2f1-3 are critical for myeloid development

Affiliations

E2f1-3 are critical for myeloid development

Prashant Trikha et al. J Biol Chem. .

Abstract

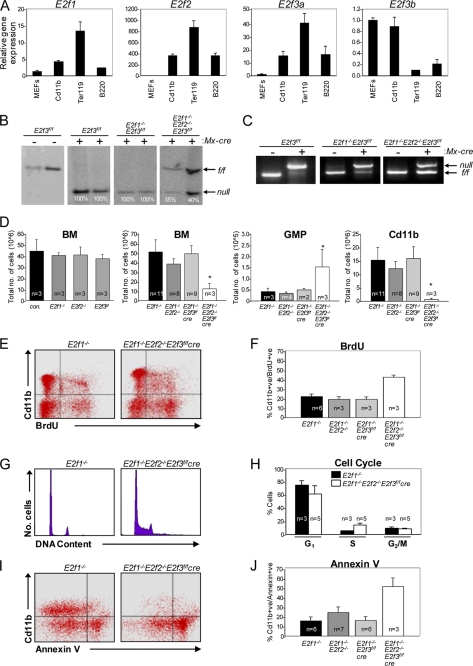
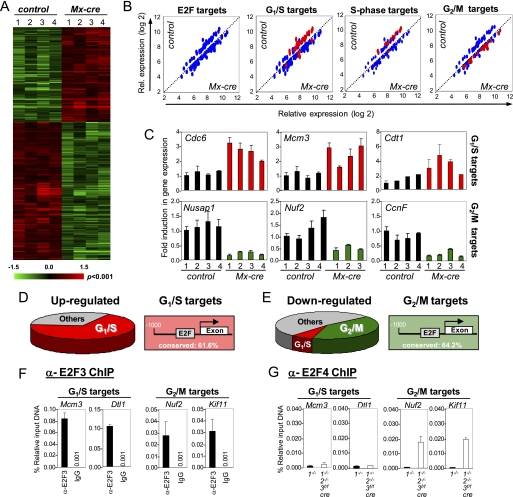
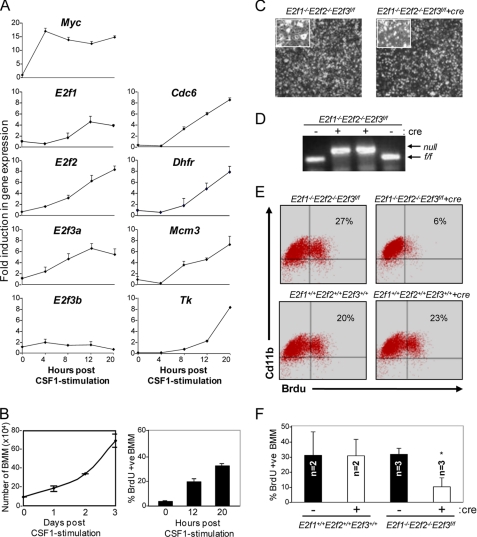
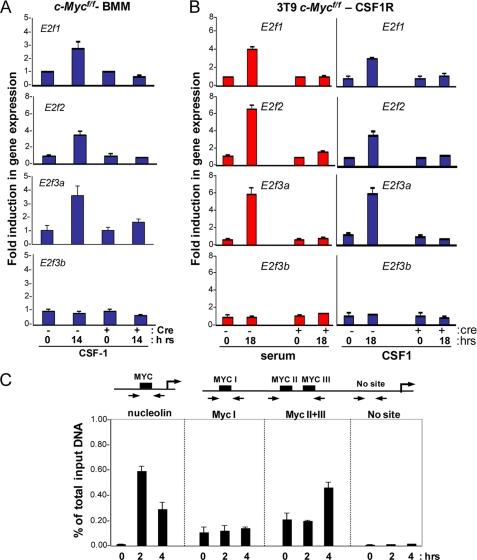
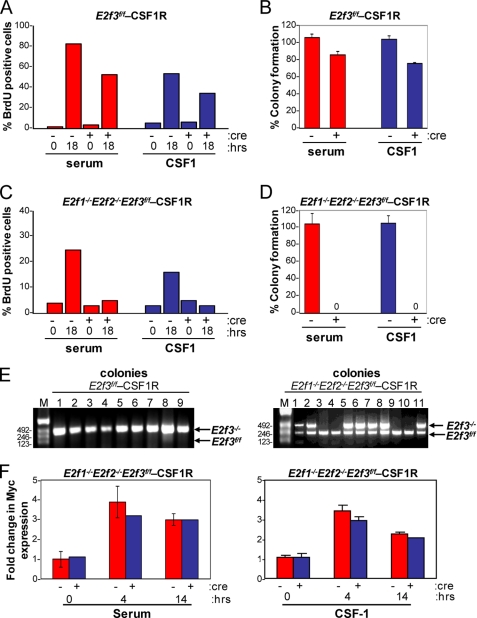
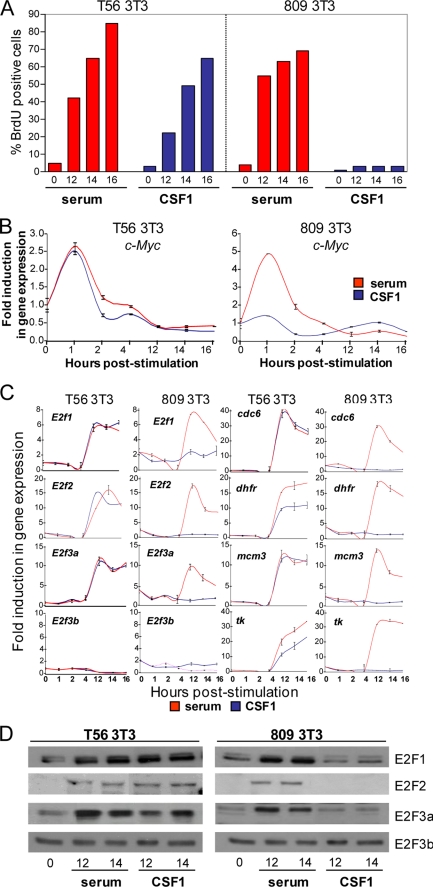
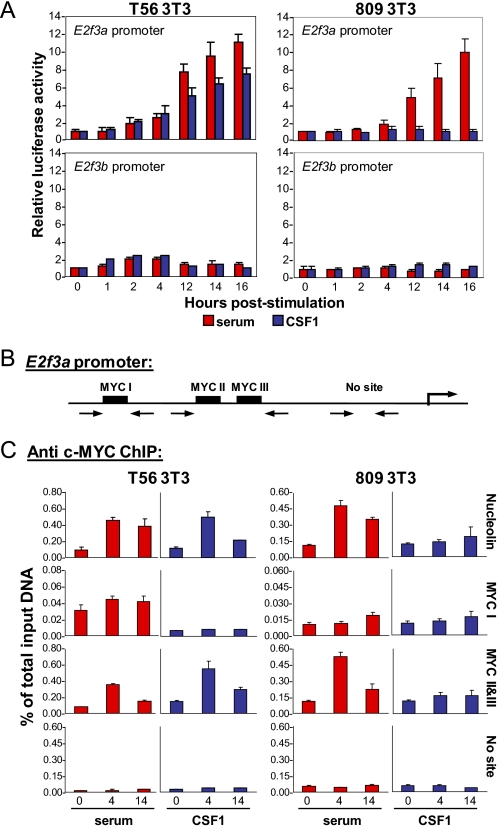
Hematopoietic development involves the coordinated activity of differentiation and cell cycle regulators. In current models of mammalian cell cycle control, E2f activators (E2f1, E2f2, and E2f3) are portrayed as the ultimate transcriptional effectors that commit cells to enter and progress through S phase. Using conditional gene knock-out strategies, we show that E2f1-3 are not required for the proliferation of early myeloid progenitors. Rather, these E2fs are critical for cell survival and proliferation at two distinct steps of myeloid development. First, E2f1-3 are required as transcriptional repressors for the survival of CD11b(+) myeloid progenitors, and then they are required as activators for the proliferation of CD11b(+) macrophages. In bone marrow macrophages, we show that E2f1-3 respond to CSF1-Myc mitogenic signals and serve to activate E2f target genes and promote their proliferation. Together, these findings expose dual functions for E2f1-3 at distinct stages of myeloid development in vivo, first as repressors in cell survival and then as activators in cell proliferation. In summary, this work places E2f1-3 in a specific signaling cascade that is critical for myeloid development in vivo.


Figures

FIGURE 1.
FIGURE 1.
E2f1–3 are essential for myeloid development. Analysis of BM cells isolated from 8–10-week-old mice 2 weeks after pIpC treatment. A, real-time PCR analysis of expression of E2f1, E2f2, E2f3a, and E2f3b in FACS-sorted cells of different hematopoietic lineages. Bone marrow cells were isolated and stained with lineage-specific antibodies (Cd11b, Ter119, and B220) and sorted by FACS. Real-time PCR was then performed on RNA isolated from these sorted cells. B, Southern blot on genomic DNA isolated from BM of Mx-cre E2f3f/f, E2f1−/−E2f3f/f, and E2f1−/−E2f2−/−E2f3f/f mice. A minimum of three samples were analyzed from each genetic group. Two representative samples analyzed from each genetic group are shown. C, E2f3 PCR genotyping on genomic DNA isolated from BM of Mx-cre E2f3f/f, E2f1−/−E2f3f/f, and E2f1−/−E2f2−/−E2f3f/f mice. D, analysis of cells isolated from femur of mice of the indicated genotype showing bone marrow cellularity (p < 0.0003), number of granulocyte-macrophage progenitors (GMP) (p < 0.018), and number of CD11b+ myeloid cells (p < 0.0002). Values are mean ± S.D. (error bars). E, FACS profile of CD11b+ myeloid cells stained with α-BrdU antibody to determine the number of cells in S phase. F, quantification of CD11b+ BrdU-positive cells; values are mean ± S.D. (p < 0.0008). G and H, analysis of DNA content in CD11b+ cells by propidium iodide staining. Values are mean ± S.D. (p < 0.003). I, representative FACS profile of myeloid cells stained with apoptotic marker annexin V. J, quantification of CD11b+ apoptotic cells. Values are mean ± S.D. (p < 0.005).
FIGURE 2.
FIGURE 2.
Ablation of E2f1–3 in BM leads to up-regulation of G1/S and down-regulation of G2/M genes in Cd11b+ myeloid cells. A, heat map showing hierarchical clustering analysis of genes differentially expressed (p < 0.001) between Mx-cre;E2f1−/−E2f2−/−E2f3f/f (Mx-cre) and E2f1−/− (control). Four independent samples were analyzed from each genetic group. B, scatter plots comparing E2f target genes between Mx-cre and E2f1−/− (control). Blue dots indicate the total number of genes that were changed. Red dots indicate G1/S and S phase target genes that are up-regulated and/or G2/M target genes that are down-regulated more than 1.5-fold. C, quantitative real-time PCR was performed to compare the relative expression of selected G1/S (top) and G2/M (bottom) E2f target genes in control and Mx-cre. The number on the y axis represents four independent samples from each genetic group. D, pie diagram illustrates that the majority of up-regulated genes in Mx-cre;E2f1−/−E2f2−/−E2f3f/f (Mx-cre) myeloid cells are E2F targets involved in G1/S regulation (left panel). The figure shows the percentage of E2f sites conserved between the human and mouse promoter (right). E, pie diagram illustrates that the majority of down-regulated genes in Mx-cre;E2f1−/−E2f2−/−E2f3f/f (Mx-cre) myeloid cells are E2f targets involved in G2/M regulation (right). F, ChIP assay showing E2f3 recruitment on promoters of G1/S and G2/M genes in wild type myeloid cells. G, ChIP assay in E2f1−/− (closed bars) and Mx-cre;E2f1−/−E2f2−/−E2f3f/f (open bars) myeloid cells showing E2f4 loading on promoters of G1/S and G2/M genes. Error bars, S.D.
FIGURE 3.
FIGURE 3.
E2f1–3 are required for BMM proliferation. A, RT-PCR analysis of E2fs and E2f target genes on BMMs at the indicated time points. The values on the y axis represent -fold induction. B, BMMs were plated at a density of 1 × 10⁵ cells/60-mm plate. Cells were grown in a medium containing 50 ng/ml CSF-1 and were harvested and counted every 24 h for 4 days (left). Cells were harvested for BrdU incorporation. Cells were stained with anti-BrdU antibody and counterstained with DAPI, and BrdU-positive cells were counted as described under “Experimental Procedures” (right). C, bright field images of vector- or cre-treated E2f1−/−2−/−3f/f BMMs at 10× magnification. D, E2f3 PCR genotyping on genomic DNA isolated from cre-treated E2f1−/−E2f2−/−E2f3f/f BMMs. E, FACS analysis of BrdU+ Cd11b+ cells of the indicated genotypes. F, BMMs from E2f1+/+2+/+3+/+ and E2f1−/−2−/−3f/f mice were infected with either vector- or cre-expressing retroviruses. BMMs were co-stained with Cd11b and BrdU and analyzed by FACS. The graph depicts the percentage of Cd11b+ cells that are also positive for BrdU. Values are mean ± S.D. (error bars) (p < 0.006).
FIGURE 4.
FIGURE 4.
c-Myc is required for the activation of E2f1, E2f2, and E2f3a. c-Mycf/f BMM or c-Mycf/f-CSF1R cells were infected with either the control or cre-expressing retroviruses and serum-starved. Quiescent cells were then restimulated with medium containing serum or CSF-1 and assessed by RT-PCR analysis for target gene expression at the indicated time points. Total RNA was used to measure the expression of the indicated E2f target genes from c-Mycf/f BMMs (A) and c-Mycf/f-CSF1R cells (B). The y axis represents the average -fold induction in gene expression, where the level at the 0 h time point is equal to 1. C, ChIP assays on lysates from wild type BMMs using antibodies for c-Myc. Immunoprecipitated DNA was measured by real-time PCR using primers flanking the Myc sites on the E2f3a promoter. Results are shown as the percentage of total input at the indicated time upon stimulation of quiescent BMMs with CSF-1. RT-PCR was performed in triplicate, and cycle numbers were normalized to 1% of the input DNA.
FIGURE 5.
FIGURE 5.
E2f1–3 are important for cellular proliferation. The E2f3f/f-CSF-1R and E2f1−/−2−/−3f/f-CSF-1R cell lines were infected with either control- or cre- expressing retroviruses and then used for the following assays. A, BrdU incorporation in E2f3f/f-CSF-1R cell line. Quiescent MEFs with the indicated genotypes were restimulated with medium containing serum or CSF-1 and assessed for BrdU incorporation at the indicated time points. A total of 500 DAPI-stained nuclei from each cell line were counted, and the percentage of BrdU-positive cells is shown. B, E2f3f/f-CSF-1R MEFs were plated for a colony formation assay. Values shown have been corrected for deletion of E2f3 by colony PCR. C, BrdU incorporation of E2f1−/−2−/−3f/f-CSF-1R cell line. The graph shows the percentage of cells positive for BrdU incorporation. D, E2f1−/−2−/−3f/f-CSF-1R MEFs were plated for a colony formation assay. Values shown have been corrected for deletion of E2f3 by colony PCR. E, E2f3 PCR genotyping on genomic DNA from the cre-infected E2f3f/f-CSF1R and E2f1−/−2−/−3f/f-CSF-1R colonies grown in the presence of CSF-1. F, bar graphs showing -fold change in c-Myc expression in control and cre-treated E2f1−/−2−/−3f/f-CSF-1R after stimulation with serum (left) or CSF-1 (right).
FIGURE 6.
FIGURE 6.
CSF-1-specific mitogenic signal leads to the activation of E2f1, E2f2, and E2f3a. A, BrdU incorporation (right) in serum-stimulated (red) and CSF-1-stimulated (blue) T56 (left) and 809 (right) NIH-3T3 cells. Quiescent MEFs with the indicated genotypes were stimulated with medium containing serum or CSF-1 and assessed for BrdU incorporation at the indicated time points as described under “Experimental Procedures.” B and C, RT-PCR analysis of c-Myc, E2fs, and E2f target gene expression. Total RNA was harvested from MEFs treated as in A and was used to measure expression of E2f target genes as described under “Experimental Procedures.” The y axis represents the average -fold induction in gene expression, where the level at the 0 h time point is equal to 1. D, cellular lysates from serum- or CSF-1-stimulated cells were used for a Western blot probed with the E2f1, E2f2, and E2f3 antibodies.
FIGURE 7.
FIGURE 7.
The E2f3a promoter, but not the E2f3b promoter, is activated by c-Myc. A, NIH-3T3 cells were transfected with either the E2f3a- or E2f3b-luciferase plasmid, along with a thymidine kinase Renilla luciferase construct as an internal control. Transfected cells were incubated in low serum and then stimulated with either serum (red) or CSF-1 (blue). Cells were harvested at the indicated time points, and luciferase activity was measured. B, schematic representation of the E2f3a promoter showing Myc binding sites. C, ChIP assays on cell lysates from synchronized T56 and 809 MEFs using antibodies for c-Myc. Results are shown as the percentage of total input at the indicated time upon stimulation of quiescent MEFs with serum or CSF-1. RT-PCR was performed in triplicate, and cycle numbers were normalized to 1% of the input DNA.

References

    1. Weissman I. L. (2000) Cell 100, 157–168 - PubMed
    1. Cheng T., Rodrigues N., Shen H., Yang Y., Dombkowski D., Sykes M., Scadden D. T. (2000) Science 287, 1804–1808 - PubMed
    1. Passegué E., Wagers A. J., Giuriato S., Anderson W. C., Weissman I. L. (2005) J. Exp. Med. 202, 1599–1611 - PMC - PubMed
    1. Kozar K., Ciemerych M. A., Rebel V. I., Shigematsu H., Zagozdzon A., Sicinska E., Geng Y., Yu Q., Bhattacharya S., Bronson R. T., Akashi K., Sicinski P. (2004) Cell 118, 477–491 - PubMed
    1. Malumbres M., Sotillo R., Santamaría D., Galán J., Cerezo A., Ortega S., Dubus P., Barbacid M. (2004) Cell 118, 493–504 - PubMed

Publication types

MeSH terms