. 2011 Jan;22(1):124-36.
doi: 10.1681/ASN.2009121311. Epub 2010 Nov 29.

Klotho deficiency causes vascular calcification in chronic kidney disease

Affiliations

Klotho deficiency causes vascular calcification in chronic kidney disease

Ming Chang Hu et al. J Am Soc Nephrol. 2011 Jan.

Abstract

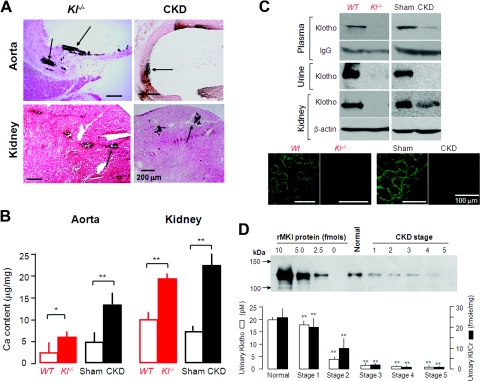
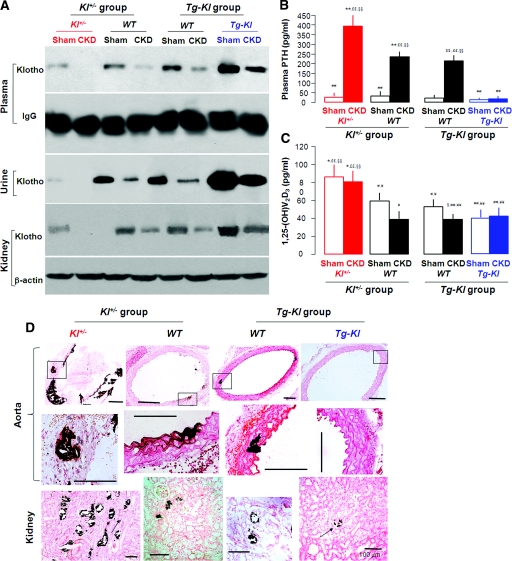
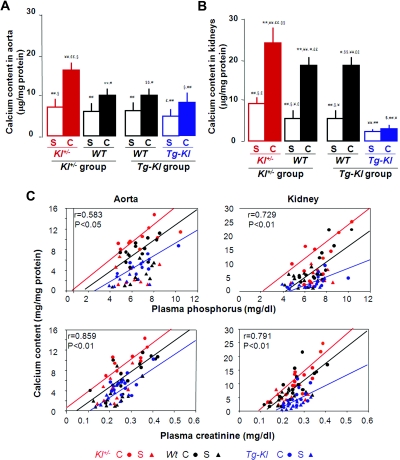
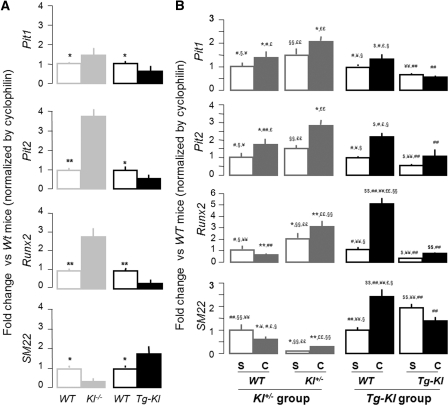
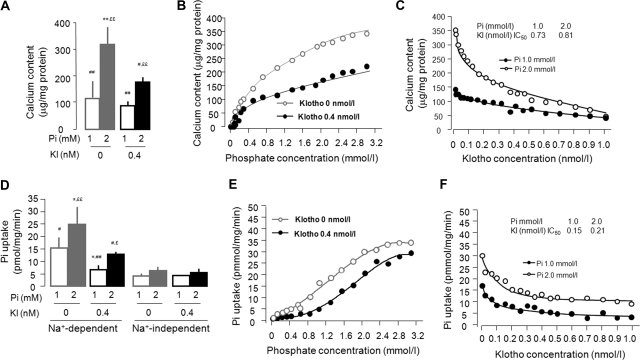
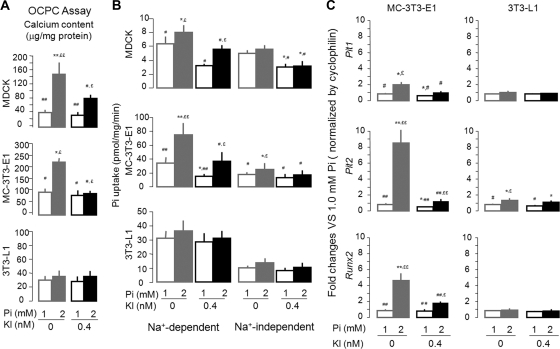
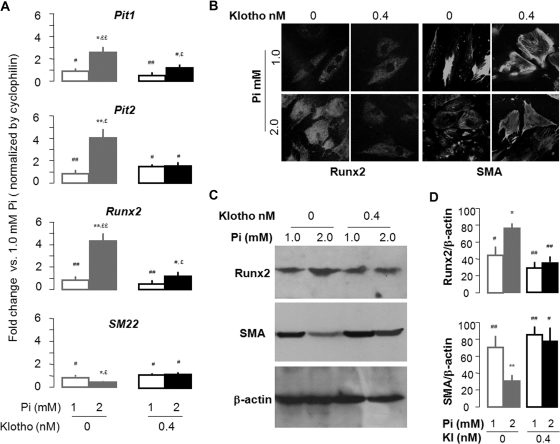
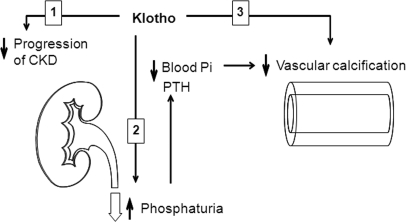
Soft-tissue calcification is a prominent feature in both chronic kidney disease (CKD) and experimental Klotho deficiency, but whether Klotho deficiency is responsible for the calcification in CKD is unknown. Here, wild-type mice with CKD had very low renal, plasma, and urinary levels of Klotho. In humans, we observed a graded reduction in urinary Klotho starting at an early stage of CKD and progressing with loss of renal function. Despite induction of CKD, transgenic mice that overexpressed Klotho had preserved levels of Klotho, enhanced phosphaturia, better renal function, and much less calcification compared with wild-type mice with CKD. Conversely, Klotho-haploinsufficient mice with CKD had undetectable levels of Klotho, worse renal function, and severe calcification. The beneficial effect of Klotho on vascular calcification was a result of more than its effect on renal function and phosphatemia, suggesting a direct effect of Klotho on the vasculature. In vitro, Klotho suppressed Na(+)-dependent uptake of phosphate and mineralization induced by high phosphate and preserved differentiation in vascular smooth muscle cells. In summary, Klotho is an early biomarker for CKD, and Klotho deficiency contributes to soft-tissue calcification in CKD. Klotho ameliorates vascular calcification by enhancing phosphaturia, preserving glomerular filtration, and directly inhibiting phosphate uptake by vascular smooth muscle. Replacement of Klotho may have therapeutic potential for CKD.


Figures

Figure 1.
Figure 1.
Klotho levels are reduced in CKD mice and CKD patients, and soft tissue calcification is observed in CKD mice. (A) Ectopic calcification in soft tissues by Von Kossa staining and calcification in aortas and kidneys of Kl−/− mice and WT CKD mice (arrows). (B) Calcium content assayed by OCPC in soft tissues (aortas and the kidneys) of Kl−/− mice versus WT littermates and also of WT CKD mice versus WT Sham mice. The data are presented as the means ± SEM (n = 4). *P < 0.05; **P < 0.01 versus WT or Sham mice by unpaired t test. (C) Representative blots of Klotho protein in plasma (n = 3), urine (n = 4), and kidney (n = 5) of Kl−/− mice or WT CKD mice. Immunoprecipitation of Klotho in 100 μl of mouse serum was followed by immunoblot. IgG heavy chain was used as the loading control. Urine Klotho was examined by directly immunoblotting approximately 40 μl of mouse urine with an identical amount of creatinine. Klotho protein in the kidney was analyzed by immunoblotting 30 μg of the total kidney lysate and qualitatively examined by immunohistochemistry. (D) Urinary Klotho protein in humans with normal kidney function and various CKD stages. The upper panel is a representative immunoblot with serial dilutions of known concentration of rMKl and concentrated human urine samples of identical amount of creatinine in same gel. The lower panel is a summary of urinary Klotho protein concentration (depicted in open bars) and of Klotho normalized by creatinine (depicted in solid bars) of normal subjects and CKD patients.
Figure 2.
Figure 2.
Klotho levels and soft tissue calcification in CKD mice are associated with genetic levels of Klotho. (A) Representative blots of Klotho protein in plasma (n = 3), urine (n = 4), and kidney (n = 4) of CKD compared with Sham mice of Kl+/−, Tg-Kl, and their WT littermate mice, respectively. (B and C) Plasma PTH (B) and 1,25-(OH)2 vitamin D3 (C) from Sham and CKD mice with different genetic Klotho background: Kl+/− (red) and Tg-Kl (blue) and their WT (black) littermates for measurement. The data are represented as the means ± SEM (n = 6). *P < 0.05; **P < 0.01 versus Sham WT mice of Kl+/− group; ¥P < 0.05; ¥¥P < 0.01 Sham Kl+/− mice; #P < 0.05; ##P < 0.01 versus CKD Kl+/− mice; $P < 0.05; $$P < 0.01 versus Sham WT mice of Tg-Kl group; §P < 0.05; §§P < 0.01 versus Sham Tg-Kl mice; £P < 0.05; ££P < 0.01 versus CKD Tg-Kl mice by one-way ANOVA followed by Student-Newman-Keul's test. (D) Von Kossa staining of calcification (arrow) in the aortas (low amplification in top panel and high amplification in middle panel) and kidneys (bottom panel) of Kl+/− CKD mice, Tg-Kl CKD mice, and their WT CKD mice, respectively. No Von Kossa staining was found in the tissues of Sham mice (data not shown).
Figure 3.
Figure 3.
The levels of calcium content in the kidneys and the aortas of Sham and CKD mice are correlated with genetic levels of Klotho. (A and B) Calcium content was assayed using OCPC in the aortas (A) and the kidneys (B) of Sham and CKD mice at different genetic Klotho levels: Kl+/− (red) and Tg-Kl (blue) and their WT littermates (black). The data are represented as the means ± SEM (n = 7). *P < 0.05; **P < 0.01 versus Sham WT mice of Kl+/− group; ¥P < 0.05; ¥¥P < 0.01 Sham Kl+/− mice; #P < 0.05; ##P < 0.01 versus CKD Kl+/− mice; $P < 0.05, $$P < 0.01 versus Sham WT mice of Tg-Kl group; §P < 0.05; §§P < 0.01 versus Sham Tg-Kl mice; £P < 0.05; ££P < 0.01 versus CKD Tg-Kl mice by one-way ANOVA followed by Student-Newman-Keul's test. (C) Relationship of calcium content in the aortas and the kidneys with blood Pi and blood Cr, respectively, in Sham (triangles) and in CKD (circles) mice at three different genetic Klotho levels: Kl+/− (red) and Tg-Kl (blue) and their WT littermates (black). C, CKD; S, Sham.
Figure 4.
Figure 4.
Klotho inhibits dedifferentiation of smooth muscle cells in the aortas of CKD mice. (A) Pit1, Pit2, Runx2, and SM22 transcripts were assessed by qPCR in the aortas of Kl−/− and Tg-Kl mice and their respective WT littermate controls. The results are represented by folds of change of target genes normalized by cyclophilin in Kl−/− or Tg-Kl mice compared with their WT littermates. The data are shown as the means ± SEM (n = 4). *P < 0.05; **P < 0.01 versus WT mice by unpaired t test. (B) The levels of Pit1, Pit2, Runx2, and SM22 transcripts were assessed by qPCR in the aortas of Kl+/− and Tg-Kl mice and their WT littermate mice of Sham and CKD. The results were represented by folds of changes of target genes normalized by cyclophilin compared with their WT Sham mice. The data are shown as the means ± SEM (n = 6). *P < 0.05; **P < 0.01 versus Sham WT mice of Kl+/− group; ¥P < 0.05; ¥¥P < 0.01 Sham Kl+/− mice; #P < 0.05; ##P < 0.01 versus CKD Kl+/− mice; $P < 0.05; $$P < 0.01 versus Sham WT mice of Tg-Kl group; §P < 0.05; §§P < 0.01 versus Sham Tg-Kl mice; £P < 0.05; ££P < 0.01 versus CKD Tg-Kl mice by one-way ANOVA followed by Student-Newman-Keul's test.
Figure 5.
Figure 5.
Klotho regulates Pi-induced mineralization and Pi uptake but not calcium uptake in cultured rat VMSC (A10). (A) A10 cells in a six-well plate were incubated in medium containing 1.0 or 2.0 Pi mM with or without 0.4 nM Klotho for 10 days to examine the Klotho effect on Pi modulated calcium content in A10 cells measured by OCPC assay. The data are presented as the means ± SEM (n = 8). *P < 0.05; **P < 0.01 versus Pi 1.0 mM + Kl 0 nM; #P < 0.05; ##P < 0.01 versus Pi 2.0 mM + Kl 0 nM; £P < 0.05; ££P < 0.01 versus Pi 1.0 mM + Kl 0.4 nM by one-way ANOVA followed by Student-Newman-Keul's test. (B) Effect of Pi on calcium content in A10 cells: dose dependence. The half-maximal effect was achieved at 0.72 mM Pi in the absence of Klotho and at 1.15 mM in 0.4 nM Klotho. (C) Effect of Klotho effect on calcium content in A10 cells: dose dependence. (D) A10 cells were incubated in medium containing 1.0 or 2.0 Pi mM with or without 0.4 nM Klotho for 3 days. Na+-dependent and Na+-independent isotopic Pi uptake was determined. The data are presented as the means ± SEM (n = 6). *P < 0.05; **P < 0.01 versus Pi 1.0 mM + Kl 0 nM; #P < 0.05; ##P < 0.01 versus Pi 2.0 mM + Kl 0 nM; £P < 0.05; ££P < 0.01 versus Pi 1.0 mM + Kl 0.4 nM by one-way ANOVA followed by Student-Newman-Keul's test. (E) Effect of Pi on Na+-dependent uptake on A10 cells: dose dependence. Vmax = 35.2 pmol/mg/min and Km = 12.2 mM Pi in the absence of Klotho, and Vmax = 31.3 pmol/mg/min and Km = 17.6 mM with 0.4 nM Klotho. (F) Effect of Klotho effect on Pi uptake in A10 cells: dose dependence. A10 cells were incubated in medium containing 1.0 or 2.0 Pi mM with or without 0.4 nM Klotho for 3 days.
Figure 6.
Figure 6.
Klotho suppresses Pi-induced mineralization, Pi uptake, and dedifferentiation in cultured kidney cells and osteoblasts but not in adipocytes. (A) Renal epithelial (MDCK), osteoblasts (MC-3T3-E1), and adipocyte (3T3-L1) cell lines in six-well plates were incubated in medium containing 1.0 or 2.0 Pi mM with or without 0.4 nM Klotho for 10 days followed by measurement of calcium content. The data are presented as the means ± SEM (n = 6). (B and C) The cells were coincubated with Pi (1.0 or 2.0 mM) and/or Klotho (0 or 0.4 nM) for 3 days followed by Pi transport assay (B) or by measurement of mRNA levels of Pit1, Pit2, and Runx2 and assayed by qPCR (C). The data are presented as the means ± SEM (n = 4). *P < 0.05; **P < 0.01 versus Pi 1.0 mM + Kl 0 nM; #P < 0.05; ##P < 0.01 versus Pi 2.0 mM + Kl 0 nM; £P < 0.05; ££P < 0.01 versus Pi 1.0 mM + Kl 0.4 nM by one-way ANOVA followed by Student-Newman-Keul's test.
Figure 7.
Figure 7.
Klotho suppresses Pit1/2 expression and Pi-induced dedifferentiation in cultured rat VMSC (A10). (A) A10 cells were incubated in medium containing 1.0 or 2.0 Pi mM with or without 0.4 nM Klotho for 3 days, and mRNA levels of Pit1, Pit2, Runx2, and SM22 were assayed by qPCR. The data are presented as the means ± SEM (n = 6). (B) The representative immunohistochemistry for Runx2 and smooth muscle actin (SMA) was shown from three independent experiments in A10 cells. (C) A representative immunoblot for Runx2, SMA, and β-actin is displayed from four independent experiments of A10 cells. (D) A summary of densitometric quantification of all samples is shown. The data are presented as the means ± SEM (n = 4). *P < 0.05; **P < 0.01 versus Pi 1.0 mM + Kl 0 nM; #P < 0.05; ##P < 0.01 versus Pi 2.0 mM + Kl 0 nM; £P < 0.05; ££P < 0.01 versus Pi 1.0 mM + Kl 0.4 nM by one-way ANOVA followed by Student-Newman-Keul's test for (A) and (D).
Figure 8.
Figure 8.
Proposed model of potential effects of Klotho on vascular calcification. Klotho can protect the vasculature against calcification in CKD probably by three actions: (1) slowing progression of CKD; (2) maintenance of normophosphatemia through induction of phosphaturia; and (3) direct inhibition of Pi influx into VSMC, which in turn suppresses the dedifferentiation of VSMC.

Comment in

References

    1. Parikh NI, Hwang SJ, Larson MG, Levy D, Fox CS: Chronic kidney disease as a predictor of cardiovascular disease (from the Framingham Heart Study). Am J Cardiol 102: 47–53, 2008 - PMC - PubMed
    1. Go AS, Chertow GM, Fan D, McCulloch CE, Hsu CY: Chronic kidney disease and the risks of death, cardiovascular events, and hospitalization. N Engl J Med 351: 1296–1305, 2004 - PubMed
    1. Mizobuchi M, Towler D, Slatopolsky E: Vascular calcification: The killer of patients with chronic kidney disease. J Am Soc Nephrol 20: 1453–1464, 2009 - PubMed
    1. Baber U, de Lemos JA, Khera A, McGuire DK, Omland T, Toto RD, Hedayati SS: Non-traditional risk factors predict coronary calcification in chronic kidney disease in a population-based cohort. Kidney Int 73: 615–621, 2008 - PubMed
    1. Wallin R, Wajih N, Greenwood GT, Sane DC: Arterial calcification: A review of mechanisms, animal models, and the prospects for therapy. Med Res Rev 21: 274–301, 2001 - PubMed

Publication types

MeSH terms