. 2011 Feb;79(2):653-62.
doi: 10.1128/IAI.01159-10. Epub 2010 Nov 29.

Adenosine deaminase inhibition prevents Clostridium difficile toxin A-induced enteritis in mice

Affiliations

Adenosine deaminase inhibition prevents Clostridium difficile toxin A-induced enteritis in mice

Ana Flávia Torquato de Araújo Junqueira et al. Infect Immun. 2011 Feb.

Abstract

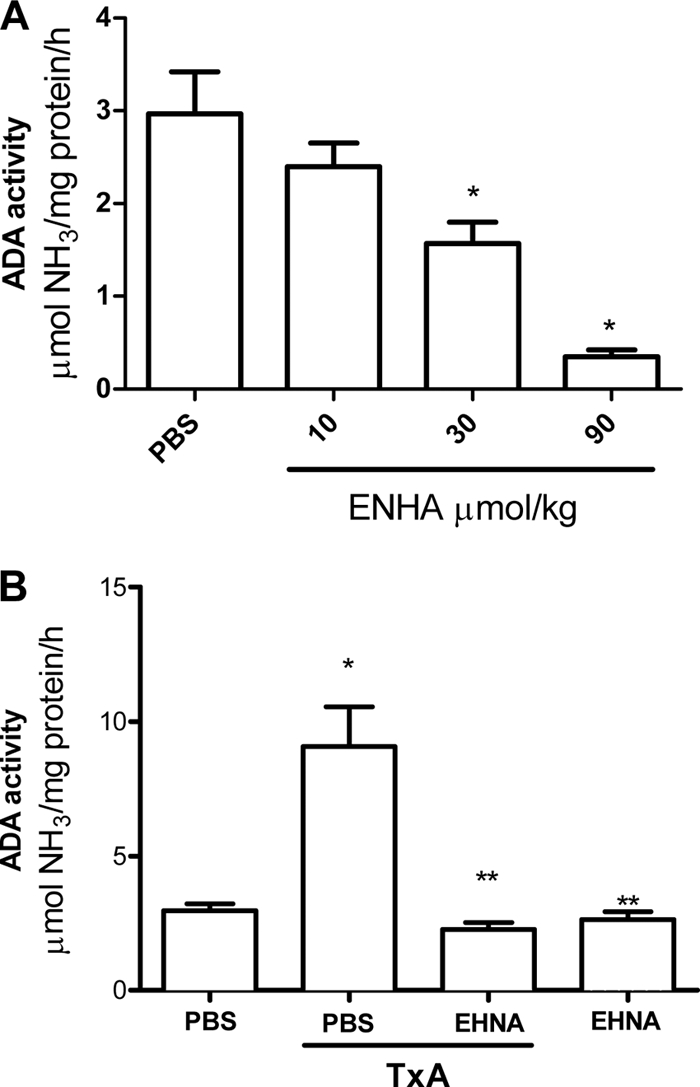
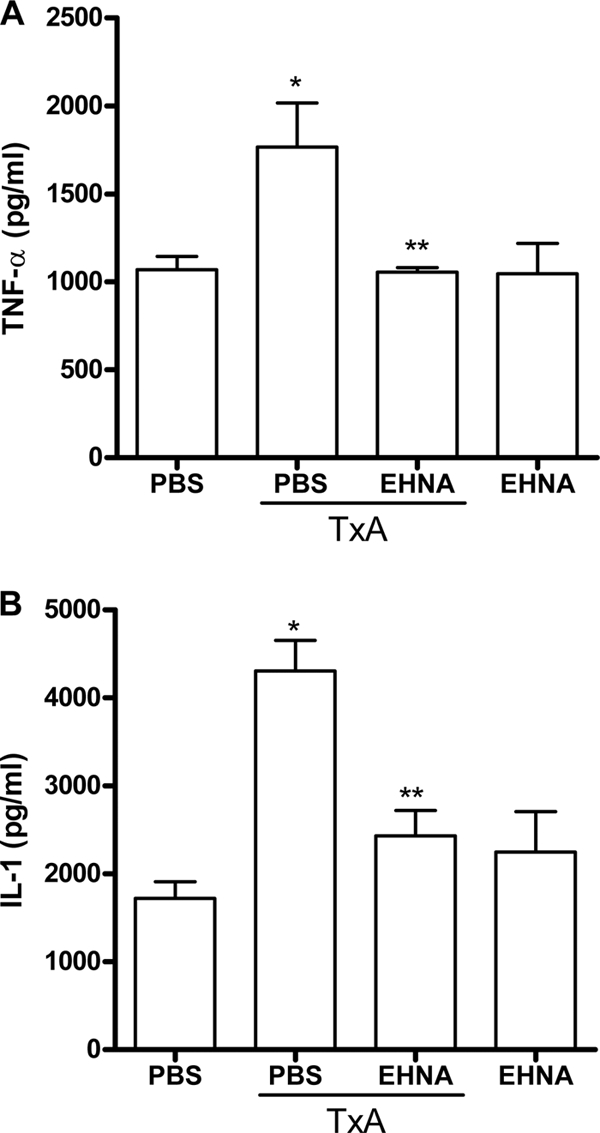
Toxin A (TxA) is able to induce most of the classical features of Clostridium difficile-associated disease in animal models. The objective of this study was to determine the effect of an inhibitor of adenosine deaminase, EHNA [erythro-9-(2-hydroxy-3-nonyl)-adenine], on TxA-induced enteritis in C57BL6 mice and on the gene expression of adenosine receptors. EHNA (90 μmol/kg) or phosphate-buffered saline (PBS) was injected intraperitoneally (i.p.) 30 min prior to TxA (50 μg) or PBS injection into the ileal loop. A(2A) adenosine receptor agonist (ATL313; 5 nM) was injected in the ileal loop immediately before TxA (50 μg) in mice pretreated with EHNA. The animals were euthanized 3 h later. The changes in the tissue were assessed by the evaluation of ileal loop weight/length and secretion volume/length ratios, histological analysis, myeloperoxidase assay (MPO), the local expression of inducible nitric oxide synthase (NOS2), pentraxin 3 (PTX3), NF-κB, tumor necrosis factor alpha (TNF-α), and interleukin-1β (IL-1β) by immunohistochemistry and/or quantitative reverse transcription-PCR (qRT-PCR). The gene expression profiles of A₁, A(2A), A(2B), and A₃ adenosine receptors also were evaluated by qRT-PCR. Adenosine deaminase inhibition, by EHNA, reduced tissue injury, neutrophil infiltration, and the levels of proinflammatory cytokines (TNF-α and IL-1β) as well as the expression of NOS2, NF-κB, and PTX3 in the ileum of mice injected with TxA. ATL313 had no additional effect on EHNA action. TxA increased the gene expression of A₁ and A(2A) adenosine receptors. Our findings show that the inhibition of adenosine deaminase by EHNA can prevent Clostridium difficile TxA-induced damage and inflammation possibly through the A(2A) adenosine receptor, suggesting that the modulation of adenosine/adenosine deaminase represents an important tool in the management of C. difficile-induced disease.


Figures

FIG. 1.
FIG. 1.
Effect of EHNA on adenosine deaminase (ADA) activity in murine ileum tissue. EHNA (10, 30, 90 μmol/kg) or PBS was injected i.p. 30 min before the injection of PBS (A) or TxA (50 μg) (B) in the ileal loop. Three hours later, the mice were sacrificed and intestinal loops were removed for the evaluation of ADA activity by the Giusti method. Bars on the graphs represent the ADA-specific activity (μmol of NH3/mg of protein/h) in the ileum tissue as means ± standard errors of the means (SEM) (n = 5 to 6). *, P < 0.05 compared to the control (PBS); **, P < 0.05 compared to the group pretreated with PBS and injected with TxA into the loop. ANOVA with Bonferroni's correction was used.
FIG. 2.
FIG. 2.
Effect of Clostridium difficile TxA on ileal loop weight and secretion volume. Ileal loops were injected with 0.1 ml of TxA (10, 20, 50, or 100 μg/loop) or phosphate-buffered saline (PBS) (A and C). Alternatively, mice received systemic pretreatment with EHNA (90 μmol/kg, i.p.) or PBS 30 min prior to the local injection of TxA (50 μg/loop) or PBS (B and D). A group of mice pretreated with EHNA were injected with ATL313 (5 nM final concentration) in the ileal loop immediately before TxA (50 μg). Three hours after the administration of TxA and PBS, mice were sacrificed. Weight/ileal loop length (mg/cm) (A and B) and secretion volume/ileal loop length (μl/cm) (C and D) are presented as means ± SEM (n = 6 to 9). *, P < 0.05 compared to the control group (PBS); **, P < 0.05 compared to group pretreated with PBS and injected with TxA into the loop. ANOVA with Bonferroni's correction was used.
FIG. 3.
FIG. 3.
Effect of EHNA on Clostridium difficile TxA-induced histological alterations. (A) Histological status when ligated ileal loops were treated with PBS only. (B) Mucosal disruption in ligated ileal loop injected with TxA (50 μg/loop). (C) Substantial prevention of mucosal disruption induced by TxA when the mouse was pretreated with EHNA (90 μmol/kg i.p.). (D) Normal aspect of the ileal mucosa of animal pretreated with EHNA (90 μmol/kg i.p.) without TxA. Hematoxylin and eosin staining was used; magnification, ×100.
FIG. 4.
FIG. 4.
Effect of EHNA on Clostridium difficile TxA-induced myeloperoxidase (MPO) activity. The mice received systemic pretreatment with EHNA (90 μmol/kg i.p.) or PBS 30 min prior to the local injection of TxA (50 μg/loop) or PBS. Three hours later, mice were euthanized and the intestinal loops were removed and frozen (−70°C) for the measurement of MPO activity. Bars on the graph represent the MPO activity (U/mg) as means ± standard error of means (SEM) (n = 6 to 7). *, P < 0.05 compared to control group (PBS); **, P < 0.05 compared to control group pretreated with PBS and injected with TxA into the loop. ANOVA with Bonferroni's correction was used.
FIG. 5.
FIG. 5.
Effect of EHNA on Clostridium difficile TxA-induced increase of concentration of cytokines. The mice received systemic pretreatment with EHNA (90 μmol/kg i.p.) or PBS 30 min prior to the local injection of TxA (50 μg/loop) or PBS. Three hours later, mice were euthanized and the intestinal loops were removed for cytokine assay by ELISA. Bars on the graph represent TNF-α and IL-1β content (means ± SEM; n = 5 to 7). *, P < 0.05 compared to control group (PBS); **, P < 0.05 compared to the group pretreated with PBS and with TxA injected into the loop. ANOVA with Bonferroni's correction was used.
FIG. 6.
FIG. 6.
Effect of EHNA on Clostridium difficile TxA-induced gene expression for cytokines and pentraxin 3 (PTX3). The mice received systemic pretreatment with EHNA (90 μmol/kg i.p.) or PBS 30 min prior to the local injection of TxA (50 μg/loop) or PBS. Three hours later, mice were sacrificed, and the intestinal loops were removed for gene expression analysis by qRT-PCR. Graphs represent the expression ratios of TNF-α, IL-1β, and PTX3 mRNAs obtained from TxA-injected ileum relative to the controls injected with PBS (means; n = 6). *, P < 0.05 compared to control group (PBS); **, P < 0.05 compared to the TxA group. ANOVA was used with the Newman-Keuls test.
FIG. 7.
FIG. 7.
Effect of EHNA on Clostridium difficile TxA-induced increase in immunostaining for inducible nitric oxide synthase (NOS2). (A) Ileal tissue of animal treated with PBS (control). (B and C) Increased number of cells immunostained for NOS2 (stained brown) in the ligated ileal loop injected with TxA (50 μg/loop). (D) Substantial prevention of TxA-induced NOS2 expression in animals pretreated with EHNA. (E) Negative control (ileal tissue not treated with NOS2 antibody). The graph represents means ± SEM of the number of cells immunostained/field. Magnification, × 400.
FIG. 8.
FIG. 8.
Effect of EHNA on Clostridium difficile TxA-induced increase in immunostaining for NF-κB-p50 NLS. (A) Ileal tissue of animal treated with PBS only. (B) Increased number of cells immunostained for NF-κB-p50 NLS (stained brown) in the ligated ileal loop injected with TxA (50 μg/loop). Arrows identify cells with immunostained nuclei. (C) Substantial prevention of TxA-induced NF-κB-p50 NLS immunostaining in animals pretreated with EHNA. (D) Negative control (ileal tissue not treated with NF-κB-p50 NLS antibody). Magnification, ×400. Smaller micrographs represent areas with a magnification of ×1,000.
FIG. 9.
FIG. 9.
Effect of Clostridium difficile TxA with or without EHNA on adenosine receptor gene expression. The mice received systemic treatment with EHNA (90 μmol/kg i.p.) or PBS 30 min prior to the local injection of TxA (50 μg/loop) or PBS. Three hours later, mice were sacrificed, and the intestinal loops were removed for gene expression analysis by qRT-PCR. Graphs represent the expression ratios of A1 (A), A2A (B), A2B (C), and A3 (D) adenosine receptor mRNAs obtained from TxA-injected ileum relative to the controls injected with PBS (means; n = 4 to 5). *, P < 0.05 compared to the control group (PBS). ANOVA was used with the Newman-Keuls test.

Similar articles

Cited by

References

    1. Barankiewicz, J., et al. 1997. Regulation of adenosine concentration and cytoprotective effects of novel reversible adenosine deaminase inhibitors. J. Pharmacol. Exp. Ther. 283:1230-1238. - PubMed
    1. Barreto, A. R., et al. 2008. Fucoidin prevents Clostridium difficile toxin-A-induced ileal enteritis in mice. Dig. Dis. Sci. 53:990-996. - PubMed
    1. Bartlett, J. G. 2002. Clinical practice. Antibiotic-associated diarrhea. N. Engl. J. Med. 346:334-339. - PubMed
    1. Blossom, D. B., and L. C. McDonald. 2007. The challenges posed by reemerging Clostridium difficile infection. Clin. Infect. Dis. 45:222-227. - PubMed
    1. Bours, M. J., E. L. Swennen, V. F. Di, B. N. Cronstein, and P. C. Dagnelie. 2006. Adenosine 5′-triphosphate and adenosine as endogenous signaling molecules in immunity and inflammation. Pharmacol. Ther. 112:358-404. - PubMed

Publication types

MeSH terms