. 2010 Sep 14;6(9):2961-2977.
doi: 10.1021/ct1002913.

The Binding Energy Distribution Analysis Method (BEDAM) for the Estimation of Protein-Ligand Binding Affinities

Affiliations

The Binding Energy Distribution Analysis Method (BEDAM) for the Estimation of Protein-Ligand Binding Affinities

Emilio Gallicchio et al. J Chem Theory Comput. .

Abstract

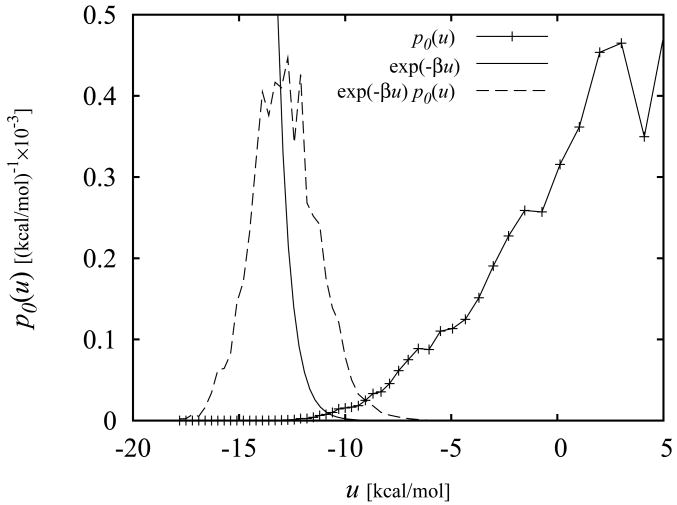
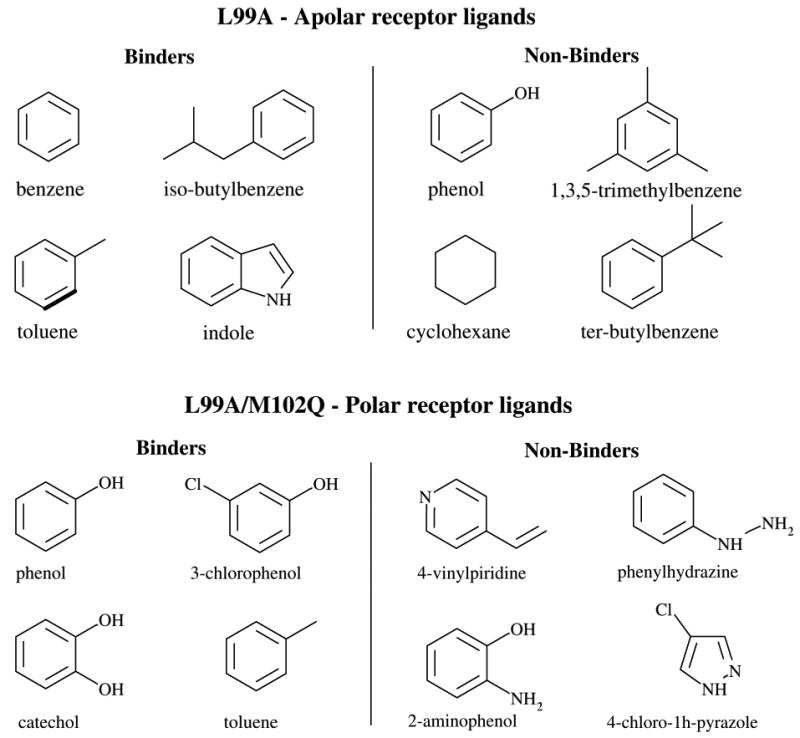
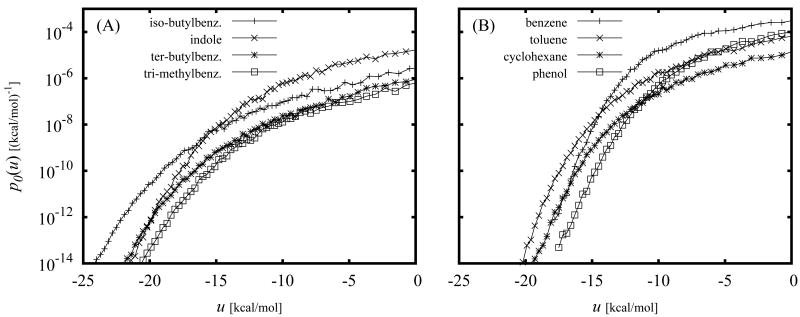
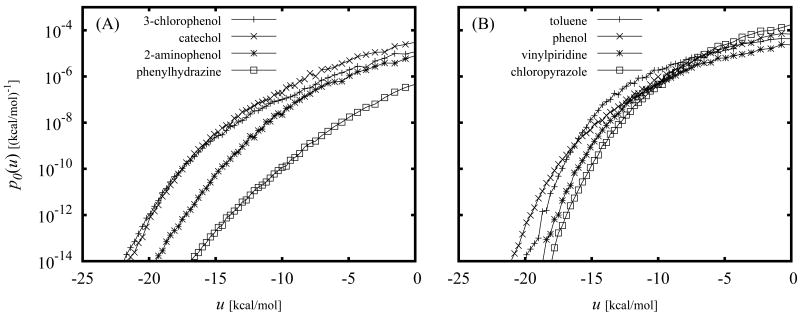
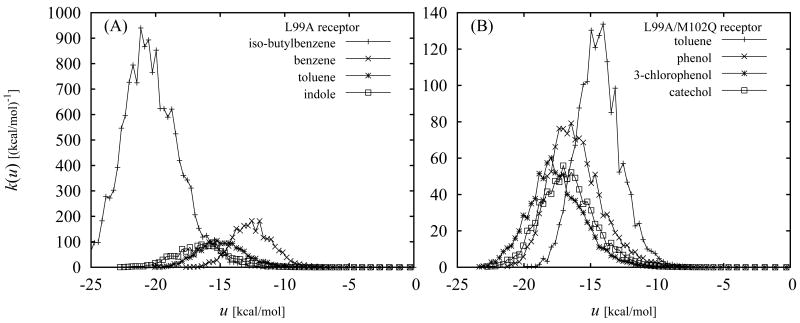
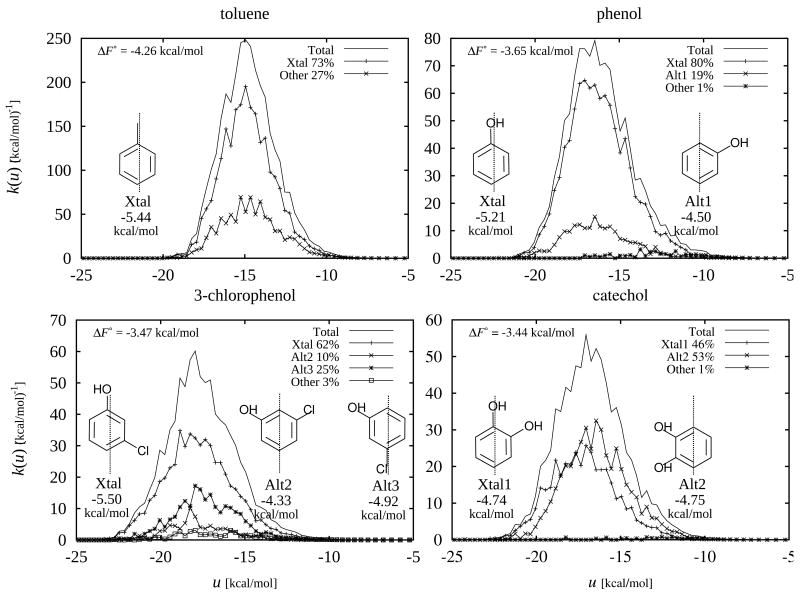
The Binding Energy Distribution Analysis Method (BEDAM) for the computation of receptor-ligand standard binding free energies with implicit solvation is presented. The method is based on a well established statistical mechanics theory of molecular association. It is shown that, in the context of implicit solvation, the theory is homologous to the test particle method of solvation thermodynamics with the solute-solvent potential represented by the effective binding energy of the protein-ligand complex. Accordingly, in BEDAM the binding constant is computed by means of a weighted integral of the probability distribution of the binding energy obtained in the canonical ensemble in which the ligand is positioned in the binding site but the receptor and the ligand interact only with the solvent continuum. It is shown that the binding energy distribution encodes all of the physical effects of binding. The balance between binding enthalpy and entropy is seen in our formalism as a balance between favorable and unfavorable binding modes which are coupled through the normalization of the binding energy distribution function. An efficient computational protocol for the binding energy distribution based on the AGBNP2 implicit solvent model, parallel Hamiltonian replica exchange sampling and histogram reweighting is developed. Applications of the method to a set of known binders and non-binders of the L99A and L99A/M102Q mutants of T4 lysozyme receptor are illustrated. The method is able to discriminate without error binders from non-binders, and the computed standard binding free energies of the binders are found to be in good agreement with experimental measurements. Analysis of the results reveals that the binding affinities of these systems reflect the contributions from multiple conformations spanning a wide range of binding energies.


Figures

Figure 1
Figure 1
Calculated binding energy distribution p0(u) for the complex between benzene and the L99A mutant of T4 lysozyme. The curves to the left correspond to the exp(−βu) and exp(−βu)p0(u) functions (rescaled to fit within the plotting area). The integral of the latter is proportional to the binding constant [Eq. (12)].
Figure 2
Figure 2
Standard binding free energy between phenol and the L99A/M102Q receptor as a function of the binding site volume. These calculations employed a simple distance-dependent dielectric model of solvation.
Figure 3
Figure 3
Standard free energy of binding of phenol to the L99A T4 lysozyme receptor with two different starting conditions as a function of simulation time from uncoupled umbrella sampling simulations (A) and from a coupled parallel Hamiltonian replica exchange simulation (B). Plus symbols (+) correspond to simulations started from the crystallographic conformation (PDB id 1LI2) and crosses correspond (×) to simulations started from a non-crystallographic conformation in which phenol is not hydrogen bonded to Q102. These calculations employed a simple distance-dependent dielectric model of solvation.
Figure 4
Figure 4
Crystal structures of the benzene-L99A (PDB id 3DMX, left) and phenol-L99A/M102Q (PDB id 1LI2, right) T4 lysozyme complexes. The A99 and M102 residues (Q102 for the L99A/M102Q receptor) are indicated. Residues 73 through 125 of T4 lysozyme are represented by the ribbon diagram. The ligand is highlighted in green. The surface surrounding the ligand represents the cavity created by the L99A and L99A/M102Q mutations.
Figure 5
Figure 5
T4 lysozyme ligands investigated in this work
Figure 6
Figure 6
Diagram depicting the definition of the pitch angle θn and in-plane rotation angle θp used in the conformational decomposition analysis. The hexagon in thick lines represents the aromatic ring of the reference pose, C1 and C3 are two atoms of the ring, O is the centroid of the heavy atoms of the ring, and n is the normal to the plane of the ring (the plane defined by O, C1, and C3). C′1, C′3, and n′ are the corresponding quantities for the ring of the given pose. θn is defined as the angle between n and n′ and θp is defined as the angle between the OC1 segment and the projection of the OC′1 segment onto the plane of the ring of the reference pose.
Figure 7
Figure 7
Samples of pitch and in-plane rotational angles pairs (θn, θp) for phenol bound to the L99A/M102Q T4 lysozyme receptor.
Figure 8
Figure 8
Favorable binding energy tails of the binding energy distributions of the L99A T4 lysozyme complexes.
Figure 9
Figure 9
Favorable binding energy tails of the binding energy distributions of the L99A/M102Q T4 lysozyme complexes.
Figure 10
Figure 10
Binding affinity densities [Eq. (17)] for the binders of the L99A (A) and L99A/M102Q (B) receptors.
Figure 11
Figure 11
Conformational decomposition of the binding affinity densities for the binders of the L99A/M102Q receptor (toluene, phenol, 3-chlorophenol, and catechol). Ligand conformational macrostates labeled “Xtal” correspond to conformations observed crystallographically, other states are labeled as “Alt”. The catch-all macrostate, which includes any conformation not included in the definition of any of the other states, is labeled as “Other”. Representative conformations of the ligand for each macrostates are schematically shown in the insets; the dotted line represents the orientation within the binding site of the crystallographic conformation. The macrostate-specific binding free energy of each macrostate from Eq. (21) is reported below the representative conformation. The binding affinity densities P0(i)ki(u) for each macrostate [Eq. (20)], weighted by the respective populations at λ = 0, are shown such that they sum to the total binding affinity density [Eq. (19)]. The relative contribution [Eq. (23)] of each macrostate to the overall binding constant is indicated as a percentage in the legend.

References

    1. Jorgensen WL. Science. 2004;303:1813–1818. - PubMed
    1. Guvench O, MacKerell AD. Curr Opin Struct Biol. 2009;19:56–61. - PMC - PubMed
    1. Brooijmans N, Kuntz ID. Annu Rev Biophys Biomol Struct. 2003;32:335–373. - PubMed
    1. McInnes C. Curr Opin Chem Biol. 2007;11:494–502. - PubMed
    1. Shoichet BK. Nature. 2004;432:862–865. - PMC - PubMed

LinkOut - more resources