. 2011:699:355-70.
doi: 10.1007/978-1-61737-950-5_17.

Noncytotoxic DsRed derivatives for whole-cell labeling

Affiliations

Noncytotoxic DsRed derivatives for whole-cell labeling

Rita L Strack et al. Methods Mol Biol. 2011.

Abstract

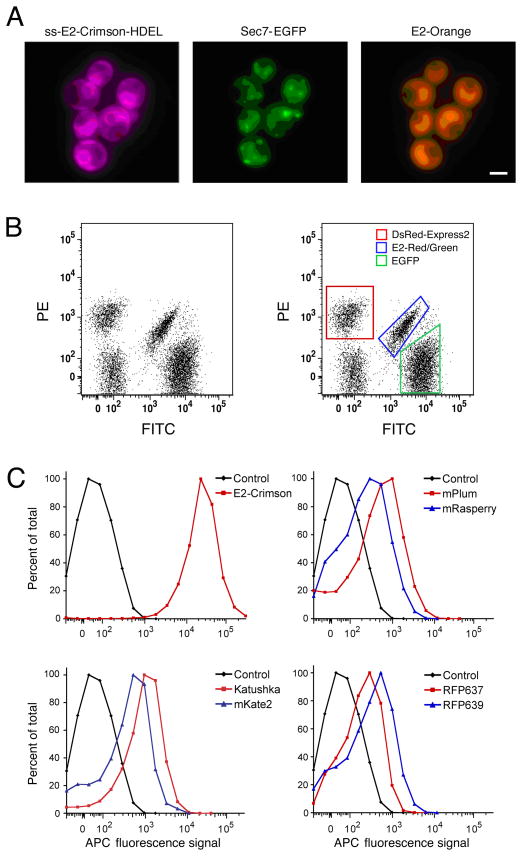
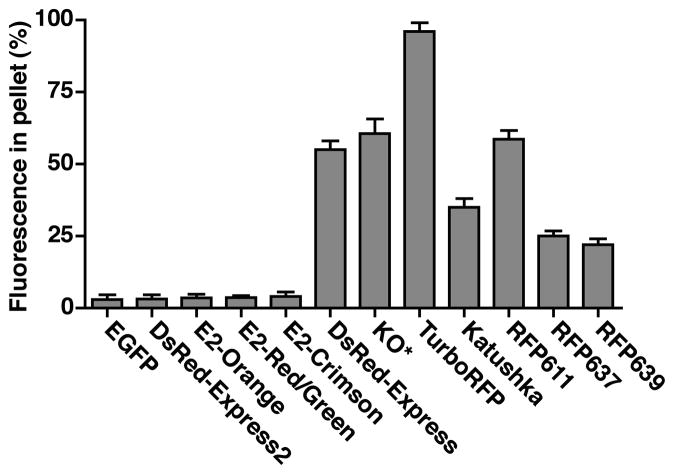
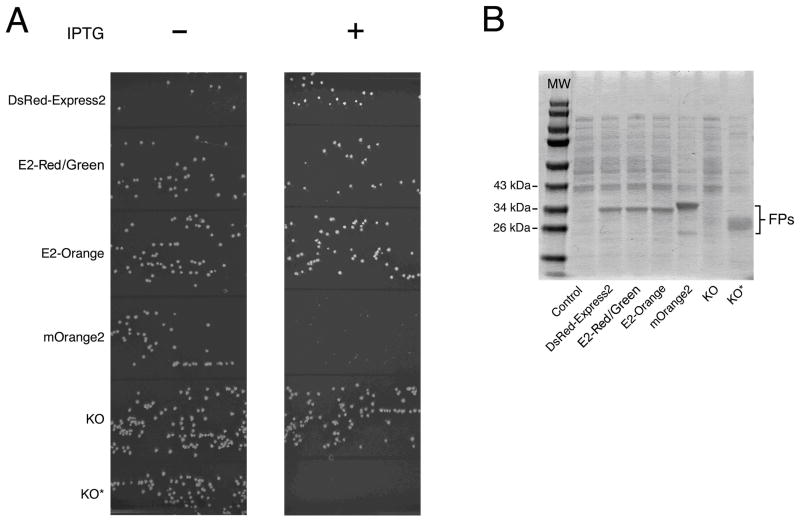
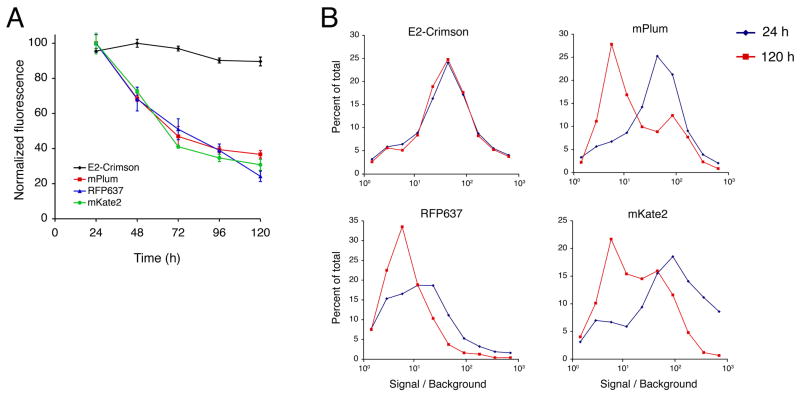
Fluorescent proteins (FPs) are invaluable tools for biomedical research. Useful FPs have desirable fluorescence properties such as brightness and photostability, but a limitation is that many orange, red, and far-red FPs are cytotoxic when expressed in the cytosol. This cytotoxicity stems from aggregation. To reduce aggregation, we engineered the surface of DsRed-Express to generate DsRed-Express2, a highly soluble tetrameric FP that is noncytotoxic in bacterial and mammalian cells. Directed evolution of DsRed-Express2 yielded the color variants E2-Orange, E2-Red/Green, and E2-Crimson. These variants can be used to label whole cells for single- and multi-color experiments employing microscopy or flow cytometry. Methods are described for reducing the higher-order aggregation of oligomeric FPs and for analyzing FP cytotoxicity in Escherichia coli and HeLa cells.


Figures

Fig 1
Fig 1
Novel applications of DsRed-Express2 derivatives. (A) E2-Orange and E2-Crimson are useful for three-color imaging with GFP. S. cerevisiae cells with the endoplasmic reticulum labeled with E2-Crimson, Golgi cisternae labeled with enhanced GFP (EGFP), and the cytosol labeled with E2-Orange were imaged using widefield microscopy with standard filter sets. (Reproduced with permission from ref. .)(B) E2-Red/Green is useful for three-color flow cytometry together with red and green FPs. S. cerevisiae cells expressing either EGFP (green box), DsRed-Express2 (red box), E2-Red/Green (blue box), or no FP were pooled and analyzed by flow cytometry with a 488-nm excitation laser. These four populations were cleanly resolvable. (Reproduced with permission from ref. .) (C) E2-Crimson is uniquely suited to flow cytometry with 633-nm excitation lasers. E. coli cells expressing various FPs or no FP (“Control”) were analyzed by flow cytometry with 633-nm excitation. Only the population expressing E2-Crimson was fully resolvable from nonfluorescent control cells. (Reproduced with permission from ref. .)
Fig 2
Fig 2
DsRed-Express2 and its derivatives are as soluble as EGFP and much more soluble than other oligomeric FPs. Oligomeric FPs were expressed in E. coli. For each FP, a bacterial lysis assay was used to determine the aggregation value, which is defined as the percentage of the total fluorescence signal in the pellet fraction. A high aggregation value indicates the formation of higher-order aggregates. As a reference, EGFP has an aggregation value of only 3%. In these assays, green fluorescence was measured with 470 ± 10 nm excitation and 510 ± 10 nm emission, orange fluorescence with 540 ± 10 nm excitation and 560 ± 10 nm emission, red fluorescence with 560 ± 20 nm excitation and 600 ± 20 nm emission, and far-red fluorescence with 595 ± 20 nm excitation and 640 ± 20 nm emission. KO* is a modified version of KO in which synonymous alternative codons were used near the translation start site to enhance bacterial expression (18). (Adapted with permission from refs. –.)
Fig 3
Fig 3
DsRed-Express2 and its derivatives are noncytotoxic when expressed at high levels in bacteria. (A) Representative colony size assay showing the bacterial cytotoxicities of several red and orange FPs. DH10B cells harboring the pREP4 repressor plasmid were transformed with pQE-60NA encoding either DsRed-Express2, E2-Red/Green, E2-Orange, mOrange2, KO, or KO* (see Figure 2 legend). In this assay, cells expressing DsRed-Express2, E2-Red/Green, and E2-Orange produced large colonies, indicating low cytotoxicity. Cells expressing mOrange2 and KO* produced very small or pinprick colonies, respectively, indicating cytotoxicity. Cells expressing KO produced large colonies, but these colonies were nearly colorless due to poor expression. (B) Quantitation of FP expression under derepressing conditions. Cells were grown to an OD600 of ~0.6 and then treated with 1 mM IPTG for 4 h. Whole-cell lysates were separated using SDS-PAGE followed by staining with Coomassie Blue. Control cells were transformed with the empty pQE-60NA vector. The image shows that KO epxression was very low, while KO* expression was comparable to that of other FPs. (Reproduced with permission from ref. .)
Fig 4
Fig 4
E2-Crimson is noncytotoxic to HeLa cells under conditions of standard high-level expression. (A) HeLa cells were transiently transfected in 24-well plates for constitutive high-level expression of the indicated FPs. For each FP, three wells per day were analyzed by flow cytometry, and the average brightness of the viable fluorescent cells was measured relative to untransfected cells. Maintenance of a high percentage of the original fluorescence indicates low cytotoxicity. (B) Fluorescence intensity distributions for the same data were analyzed for 24 h (blue) and 120 h (red) post-transfection. Each data point is a binned value that represents the percentage of cells with fluorescence in a range centered about the data point. Cells expressing E2-Crimson maintained a nearly identical population distribution over the course of the experiment, while cells expressing the other FPs showed dramatic population shifts in favor of dimmer cells. (Reproduced with permission from ref. .)
Fig 5
Fig 5
Fluorescent protein cytotoxicities after lentiviral transduction. (A) HeLa cells were transduced with lentiviral particles encoding the indicated FPs or with a control lentiviral particles lacking an FP gene. At 3 and 10 days after transduction, cells were analyzed by flow cytometry. Plotted are the average fluorescence signals from viable fluorescent cells relative to the control. (B) The percentage of viable cells that were fluorescent was also recorded at 3 and 10 days after transduction. In these experiments, DsRed-Express2 and monomeric EGFP (mEGFP, which is EGFP with the A206K mutation) maintained almost all of the original fluorescence signal and showed only a small decline in the percentage of fluorescent cells. By contrast, all of the other red FPs showed dramatic reductions in average fluorescence and in the percentage of fluorescent cells, indicating that those other FPs were cytotoxic. (Reproduced with permission from ref. .)

References

    1. Chalfie M, Tu Y, Euskirchen G, Ward WW, Prasher DC. Green fluorescent protein as a marker for gene expression. Science. 1994;263:802–5. - PubMed
    1. Shaner NC, Steinbach PA, Tsien RY. A guide to choosing fluorescent proteins. Nat Methods. 2005;2:905–9. - PubMed
    1. Shaner NC, Campbell RE, Steinbach PA, Giepmans BNG, Palmer AE, Tsien RY. Improved monomeric red, orange and yellow fluorescent proteins derived from Discosoma sp. red fluorescent protein. Nat Biotechnol. 2005;22:1567–72. - PubMed
    1. Wang L, Jackson WC, Steinbach PA, Tsien RY. Evolution of new nonantibody proteins via iterative somatic hypermutation. Proc Natl Acad Sci USA. 2004;101:16745–9. - PMC - PubMed
    1. Strongin DE, Bevis B, Khuong N, Downing ME, Strack RL, Sundaram K, Glick BS, Keenan RJ. Structural rearrangements near the chromophore influence the maturation speed and brightness of DsRed variants. Protein Eng Des Sel. 2007;20:525–34. - PubMed

Substances

LinkOut - more resources