. 2010 Dec 28;4(12):7603-11.
doi: 10.1021/nn102345f. Epub 2010 Nov 30.

Intracellular delivery of bioactive molecules using light-addressable nanocapsules

Affiliations

Intracellular delivery of bioactive molecules using light-addressable nanocapsules

Kimberly A D Gregersen et al. ACS Nano. .

Abstract

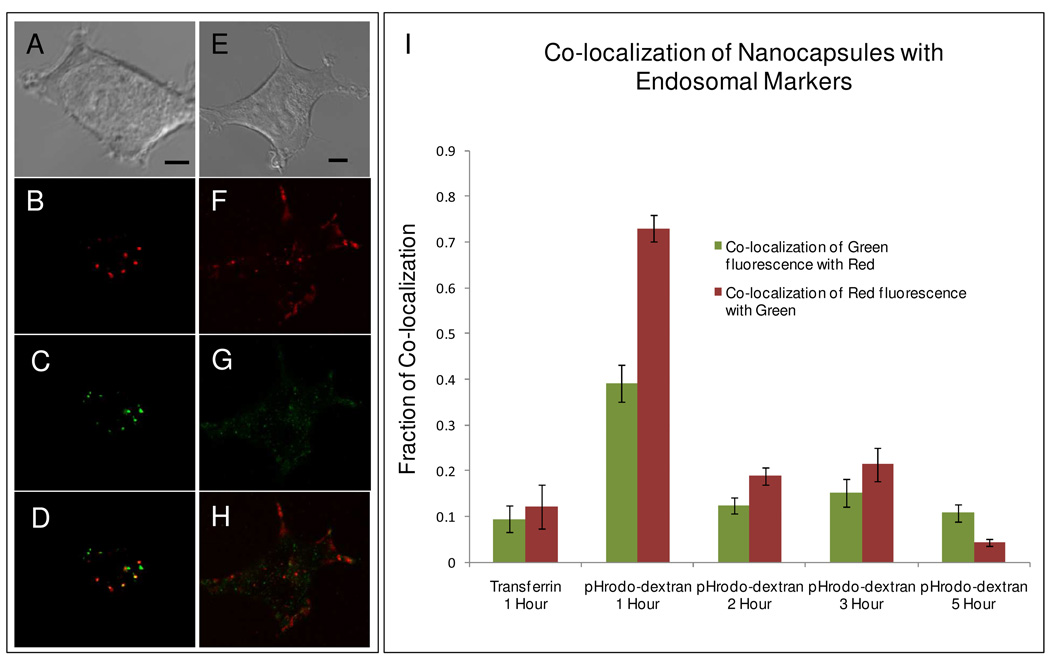
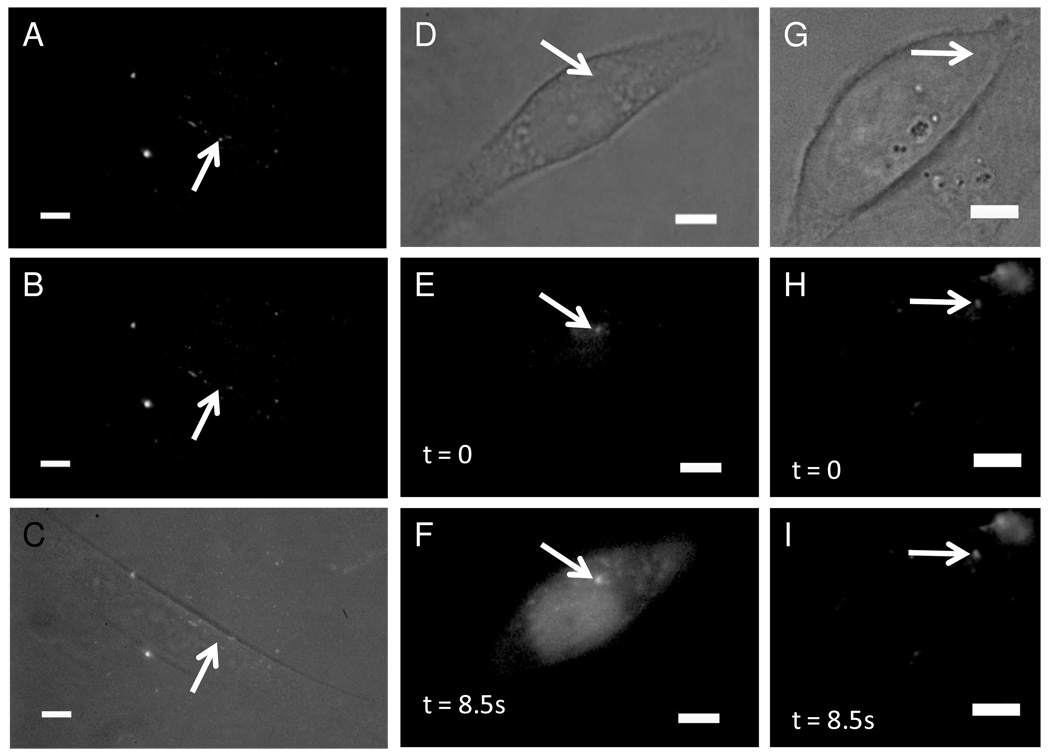
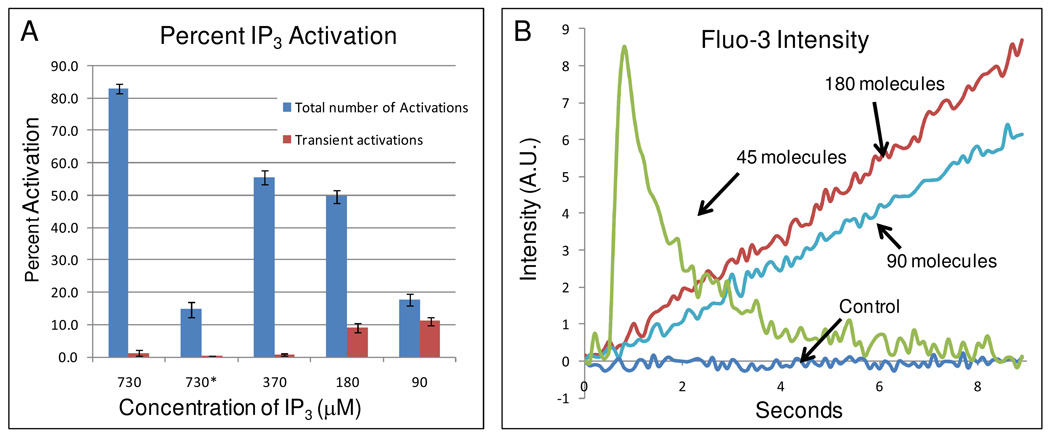
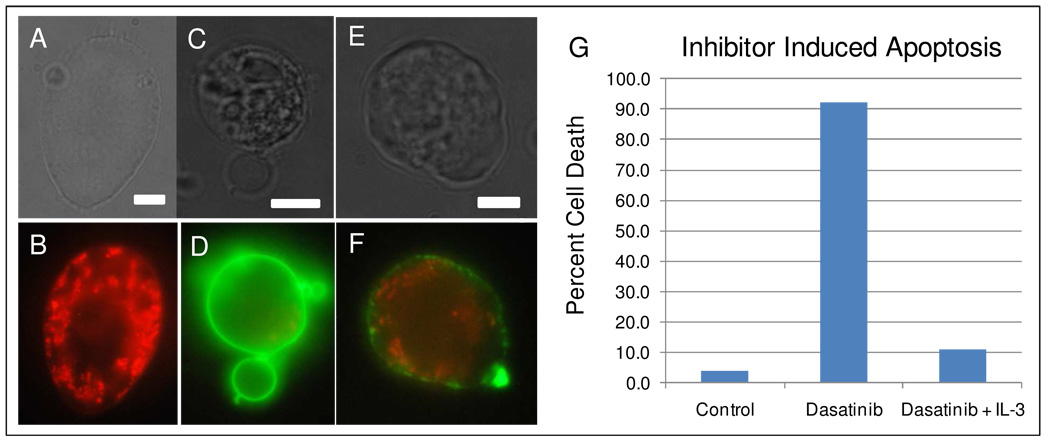
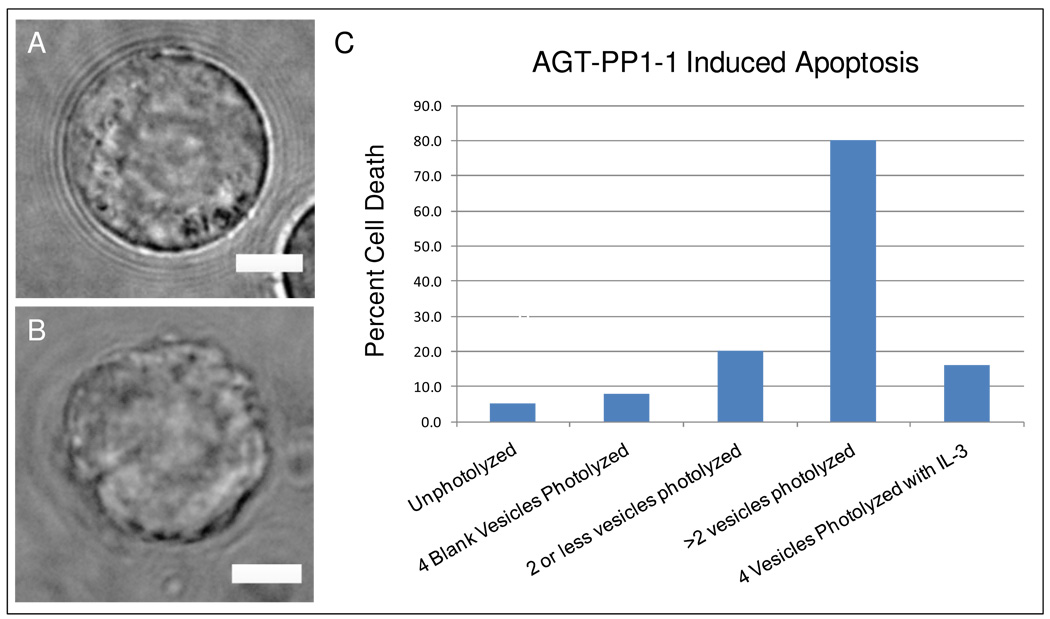
This paper describes a method by which molecules that are impermeable to cells are encapsulated in dye-sensitized lipid nanocapsules for delivery into cells via endocytosis. Once inside the cells, the molecules are released from the lipid nanocapsules into the cytoplasm with a single nanosecond pulse from a laser in the far red (645 nm). We demonstrate this method with the intracellular release of the second messenger IP(3) in CHO-M1 cells and report that calcium responses from the cells changed from a sustained increase to a transient spike when the average number of IP(3) released is decreased below 50 molecules per nanocapsule. We also demonstrate the delivery of a 23 kDa O(6)-alkylguanine-DNA alkyltransferase (AGT) fusion protein into Ba/F3 cells to inhibit a key player BCR-ABL in the apoptotic pathway. We show that an average of ∼8 molecules of the inhibitor is sufficient to induce apoptosis in the majority of Ba/F3 cells.


Figures

Figure 1
Figure 1. Co-localization study of lipid nanocapsules with endosomal markers
Images of HEK 293 cells that were loaded for 1 hour with 100-nm-diameter 9:1 DPPC:DOPC+4mol% DiD nanocapsules and endosomal markers (A–D) pHrodo-dextran and (E–H) transferrin-Alexa 488. The cells were then washed and imaged immediately. Red fluorescence is from DiD and green fluorescence is from the endosomal marker. Scale bar represents 4 µm. (I) Histogram plot of Mander’s coefficient displaying co-localization of lipid nanocapsules with the respective endosomal markers. Again, cells were loaded with lipid nanocapsules and endosomal markers for one hour, washed, then imaged immediately and then 2–5 hours after the start of incubation. For each case 30–35 cells were imaged for data collection.
Figure 2
Figure 2. Release of encapsulated contents from endocytosed lipid nanocapsules into the cytoplasm
The lipid nanocapsules were photolyzed by a single 3-ns pulse of 645-nm light after 2 hours of incubation followed by 2 washing steps. (A–C) CHO-M1 cells loaded with 100-nm-diameter nanocapsules consisting of 9:1 DPPC:DOPC+4mol% DiD and 50µM Alexa-488. (D–F) CHO-M1 cells loaded with the calcium indicator dye fluo-3 and 100-nm-diameter nanocapsules made of 9:1 DPPC:DOPC+4mol% DiD+1mol% DiO and 730µM IP3. (G–I) CHO-M1 cells loaded with fluo-3 and empty 100-nm-diameter nanocapsules made of 9:1 DPPC:DOPC+4mol% DiD+1mol% DiO. Fluorescence is from 488nm excitation in the epifluorescence configuration; the scale bar is 5µm.
Figure 3
Figure 3. Dose dependent response from single cells after cytoplasmic delivery of IP3
(A) Histogram plot showing the percent calcium activation as measured using fluo-3 versus the average concentrations of IP3 contained within the 100nm lipid nanocapsules. The blue bars show the fraction of cells exhibiting a calcium response, including both sustained and transient calcium increases. The red bars show only those cells that exhibited a transient calcium increase. At the 90 µM of IP3, the majority of calcium responses was transient, in sharp contrast to the 370 µM result where nearly all responses were sustained. All measurements were performed at 2.5 hours after the start of lipid nanocapsule loading, with the exception of the 730* results, which were obtained at the 1-hour time point after loading was initiated. Total N = 150 cells for each bar (50 cell activation attempts over 3 days for each bar). (B) Plots showing the increase in calcium as a function of time, illustrating examples of sustained and transient responses. The control indicates photolysis of an empty vesicle. The cells used for these experiments were CHO-M1.
Figure 4
Figure 4. Apoptosis of Ba/F3 cells induced by inhibition of BCR-ABL
(A–B)Healthy Ba/F3 cell stained with MitoTracker Red and Annexin-Alexa 488. (C–F)Apoptotic cells stained with MitoTracker Red and Annexin-Alexa 488. Scale bar is 5 µm. (G) Histogram of cell death in Ba/F3 cells. From left to right, percent cell death of unperturbed (control), cells exposed to 5µM Dasatinib, and cells exposed to 5µM Dasatinib and 1 ng/ml IL-3. For each bar in the histogram, N=100 cells.
Figure 5
Figure 5. Apoptosis is induced in the majority of Ba/F3 cells with only eight molecules of the 23 kDa protein inhibitor of BCR-ABL
Images of a (A)healthy and (B)dying cell observed using oblique illumination. Scale bar is 5 µm. (C) Histogram of cell death in Ba/F3 cells. From left to right, cells loaded with 100nm lipid nanocapsules containing AGT-PP1-1 for six hours and left unphotolyzed; cells in which 4 empty lipid nanocapsules were photolyzed; cells in which 1–2 lipid nanocapsules containing AGT-PP1-1 were photolyzed; cells in which 3–4 lipid nanocapsules containing AGT-PP1-1 were photolyzed; and cells in which 4 lipid nanocapsules containing AGT-PP1-1 were photolyzed in the presence of 1 ng/ml IL-3. For each bar in the histogram, N=25 cells.

References

    1. Gug S, Charon S, Specht A, Alarcon K, Ogden D, Zietz B, Leonard J, Haacke S, Bolze F, Nicoud JF, et al. M. Photolabile Glutamate Protecting Group with High One- and Two-Photon Uncaging Efficiencies. ChemBioChem. 2008;9:1303–1307. - PubMed
    1. Matsuzaki M, Hayama T, Kasai H, Ellis-Davies GCR. Two-Photon Uncaging of Gamma-Aminobutyric Acid in Intact Brain Tissue. Nat. Chem. Biol. 2010;6:255–257. - PMC - PubMed
    1. Kantevari S, Matsuzaki M, Kanemoto Y, Kasai H, Ellis-Davies GCR. Two-Color, Two-Photon Uncaging of Glutamate and GABA. Nat. Methods. 2010;7:123–125. - PMC - PubMed
    1. Warther D, Bolze F, Leonard J, Gug S, Specht A, Puliti D, Sun XH, Kessler P, Lutz Y, Vonesch JL, et al. Live-cell One- and Two-Photon Uncaging of a Far-Red Emitting Acridinone Fluorophore. J. Am. Chem. Soc. 2010;132:2585–2590. - PubMed
    1. Nikolenko V, Poskanzer KE, Yuste R. Two-Photon Photostimulation and Imaging of Neural Circuits. Nat. Methods. 2007;4:943–950. - PubMed

Publication types

MeSH terms