Review
. 2010 Nov 30:9:346.
doi: 10.1186/1475-2875-9-346.

Automated haematology analysis to diagnose malaria

Affiliations
Review

Automated haematology analysis to diagnose malaria

Germán Campuzano-Zuluaga et al. Malar J. .

Abstract

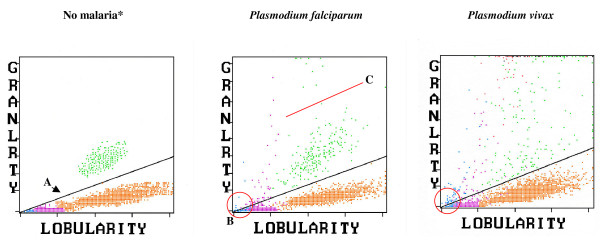
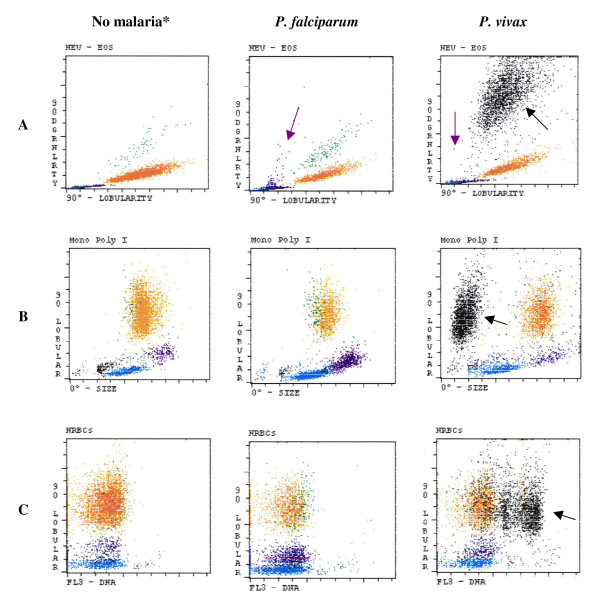
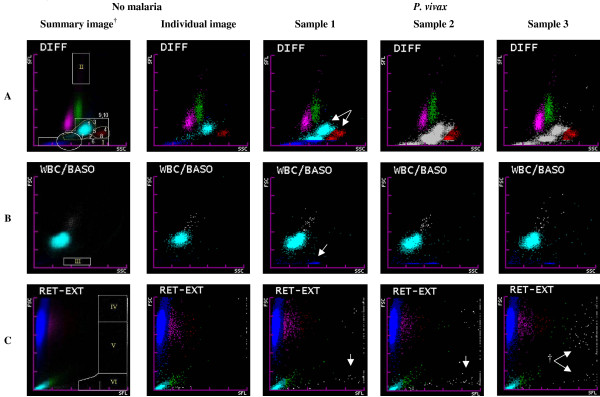
For more than a decade, flow cytometry-based automated haematology analysers have been studied for malaria diagnosis. Although current haematology analysers are not specifically designed to detect malaria-related abnormalities, most studies have found sensitivities that comply with WHO malaria-diagnostic guidelines, i.e. ≥ 95% in samples with > 100 parasites/μl. Establishing a correct and early malaria diagnosis is a prerequisite for an adequate treatment and to minimizing adverse outcomes. Expert light microscopy remains the 'gold standard' for malaria diagnosis in most clinical settings. However, it requires an explicit request from clinicians and has variable accuracy. Malaria diagnosis with flow cytometry-based haematology analysers could become an important adjuvant diagnostic tool in the routine laboratory work-up of febrile patients in or returning from malaria-endemic regions. Haematology analysers so far studied for malaria diagnosis are the Cell-Dyn®, Coulter® GEN·S and LH 750, and the Sysmex XE-2100® analysers. For Cell-Dyn analysers, abnormal depolarization events mainly in the lobularity/granularity and other scatter-plots, and various reticulocyte abnormalities have shown overall sensitivities and specificities of 49% to 97% and 61% to 100%, respectively. For the Coulter analysers, a 'malaria factor' using the monocyte and lymphocyte size standard deviations obtained by impedance detection has shown overall sensitivities and specificities of 82% to 98% and 72% to 94%, respectively. For the XE-2100, abnormal patterns in the DIFF, WBC/BASO, and RET-EXT scatter-plots, and pseudoeosinophilia and other abnormal haematological variables have been described, and multivariate diagnostic models have been designed with overall sensitivities and specificities of 86% to 97% and 81% to 98%, respectively. The accuracy for malaria diagnosis may vary according to species, parasite load, immunity and clinical context where the method is applied. Future developments in new haematology analysers such as considerably simplified, robust and inexpensive devices for malaria detection fitted with an automatically generated alert could improve the detection capacity of these instruments and potentially expand their clinical utility in malaria diagnosis.


Figures

Figure 1
Figure 1
Cell-Dyn 3700 side-scatter/depolarized side-scatter plot of samples with no malaria, P. falciparum and P. vivax malaria. A. The diagonal line gives optimal separation between eosinophils (green) and neutrophils (orange). In the P. falciparum sample (middle panel) purple dots indicate depolarizing monocytes. At the top of the scatter-plot are haemozoin-containing neutrophils misclassified as eosinophils. Blue-coded depolarizing events might possibly be small haemozoin-containing monocytes. In the P. vivax sample (right panel), the changes are more pronounced, and additionally haemozoin-containing RBC (red) appear to be present. B. As the diagonal line reaches the 0/0 point (red circle), small increases in depolarization may cause monocyte/lymphocyte events to easily surpass this line and be classified as depolarizing (false positives). C. In the middle panel it is easy to distinguish two green-coded populations below (eosinophils) and above the red line (haemozoin-containing neutrophils), which is not always the case (see P. vivax sample). * Colour code for events displayed is, blue: lymphocytes; purple: monocytes; orange: neutrophils; green: eosinophils; red: erythrocytes; black: not classified.
Figure 2
Figure 2
Cell-Dyn 4000 scatter-plots of samples with no malaria parasites, P. falciparum and P. vivax. A. Haemozoin detection by depolarization in the NEU-EOS scatter-plot: Haemozoin-containing monocytes (purple dots) in eosinophil area (purple arrows). Large black-coded population (black arrow) in P. vivax infection (right scatter-plot). B. Detection by size and depolarized side-scatter in the 'mono poly I' scatter-plot: No difference between 'no malaria' and P. falciparum, while a large population of small size black-coded events appears in the sample with P. vivax. C. Detection of parasite DNA in the nucleated red blood cells (NRBC) scatter-plot by propidium iodide staining: No difference between 'no malaria' and P. falciparum while a large population of black-coded events with high degree of FL3 fluorescence appears in the P. vivax case. Black-coded events may represent parasites (see text), 90 Dgrnlrty: 90° depolarization side-scatter; 90° lobular: 90° side-scatter; 0° Size: forward-scatter; FL3-DNA: fluorescent detection of propidium iodide. *Colour code for events displayed is, blue: lymphocytes; purple: monocytes; orange: neutrophils; green: eosinophils; red: erythrocytes; black: not classified.
Figure 3
Figure 3
Summary of proposed malaria diagnostic criteria for the Abbott Cell-Dyn, Coulter GEN·S and LH 750, and Sysmex XE-2100 haematology analysers. *Non-Observer Dependent (N-OD) models use the logistic regression predicted probability equation: 11+e(β0+β1x1+β2x2+...+βnxn)=PP, where β0 and β1,2, ... n correspond to the intercept and variable's coefficients, x1,2, ... n are the values for each variable obtained for each individual blood sample, and PP is the predicted probability for which the optimal diagnosis cut-off is show in the figure [51]. Samples with a 'Predicted Probability' (PP) above the cut-off are considered positive for malaria and could be flagged by a programmed Laboratory Information System. Variables for N-OD1Pv: plateletcrit; ratio between DIFF channel and total WBC count (ΔDIFF/WBC); and mean value of LYMPH-Y in arbitrary units (LYMPHY). Variables for N-OD1Pf: Optical platelet count (PLTO); red cell distribution width SD (RDWSD); and LYMPH-Y in arbitrary units (LYMPHY).
Figure 4
Figure 4
Normal and abnormal Sysmex XE-2100 scatter-plots where P. vivax-related findings have been identified. Sysmex XE-2100 summary images composed of 50 superimposed images from samples without malaria, with lines delimiting where P. vivax-associated abnormalities appear. 1. neutrophils, outside limit (yellow line); 2. neutrophils, inferior deviation; 3. neutrophils, right deviation; 4. eosinophils, outside limit (yellow line); 5. confluent neutrophils and eosinophils; 6. granulocytes outside inferior limit; 7. ≥2 neutrophil-coded groups; 8. ≥2 eosinophil-coded groups; 9. tendency of granulocytes to form one group; 10. abnormal granulocyte colour (gray or normal). Variables 1 to 10 are used to obtain the Malaria Score (M-ODPv, Figure 3). Pixel-counting areas were malaria related events appear are DIFF(I), DIFF(II), WBC/BASO(III), RET-EXT(IV), RET-EXT(V) and RET-EXT(VI). A. DIFF (SSC versus SFL) scatter-plot shows lymphocytes (magenta), monocytes (green), neutrophils (sky blue), eosinophils (red) and RBC ghosts (blue), non-identified events (gray). The malaria related abnormalities are shown in the images from three samples with 'P. vivax', for example, the duplication and fusion of the neutrophil and eosinophil groups (arrows) and gray-coded groups. B. WBC/BASO (SSC versus FSC) scatter-plot: Separates WBCs (sky blue) from basophils (gray). Malaria-related findings can be seen WBC/BASO(III) counting area (arrow). Malaria related findings that appear in the high SSC range of both the DIFF and WBC/BASO scatter-plot could be caused by haemozoin crystals in mature parasites [51]. C. RET-EXT (SFL versus FSC) scatter-plot: FSC differentiates RBC (high FSC, blue-magenta-red SLF progression) and platelets (low FSC, sky blue-green SFL progression) based on their size. Gray events usually correspond to WBC nuclear debris (high SFL). However, in P. vivax infected samples, †gray-coded events with middle and low FSC (arrows) and high SFL values can be found in the RET-EXT(V) and (VI) counting areas and could be generated by the parasite's nucleic acids [51].

References

    1. Giemsa G. Eine Vereinfachung und Vervollkommnung meiner Methylenblau-Eosin-Färbemethode zur Erzielung der Romanowsky-Nocht'schen Chromatinfärbung. Centralblatt für Bakteriologie. 1904;32:307–313.
    1. Wongsrichanalai C, Barcus MJ, Muth S, Sutamihardja A, Wernsdorfer WH. A review of malaria diagnostic tools: microscopy and rapid diagnostic test (RDT) Am J Trop Med Hyg. 2007;77:119–127. - PubMed
    1. WHO. New perspectives. Malaria Diagnosis. Report of a Joint WHO/USAID Informal Consultation 25-27 October 1999. Geneva: World Health Organization; 2000.
    1. Gautam AS, Sharma RC, Bhatt RM, Gupta DK. Microscopic diagnosis of malaria in Kheda district of Gujarat. Indian J Malariol. 1992;29:83–87. - PubMed
    1. Durrhelm DN, Becker PJ, Billinghurst K, Brink A. Diagnostic disagreement--the lessons learnt from malaria diagnosis in Mpumalanga. S Afr Med J. 1997;87:609–611. - PubMed