. 2011 Mar;30(3):792-803.
doi: 10.1109/TMI.2010.2095465. Epub 2010 Nov 29.

Prostate segmentation in HIFU therapy

Affiliations

Prostate segmentation in HIFU therapy

Carole Garnier et al. IEEE Trans Med Imaging. 2011 Mar.

Abstract

Prostate segmentation in 3-D transrectal ultrasound images is an important step in the definition of the intra-operative planning of high intensity focused ultrasound (HIFU) therapy. This paper presents two main approaches for the semi-automatic methods based on discrete dynamic contour and optimal surface detection. They operate in 3-D and require a minimal user interaction. They are considered both alone or sequentially combined, with and without postregularization, and applied on anisotropic and isotropic volumes. Their performance, using different metrics, has been evaluated on a set of 28 3-D images by comparison with two expert delineations. For the most efficient algorithm, the symmetric average surface distance was found to be 0.77 mm.


Figures

Fig. 1
Fig. 1
Ultrasound images of a prostate and its surrounding organs. The prostate appears darker and is not centered. Its boundary is almost well defined in this favorable case (central slices). Left: axial slice of the volume (the transducer being located on the lower, black area of the image). Right: sagittal slice.
Fig. 2
Fig. 2
Axial ultrasound images of (a) the prostate base, (b) the prostate apex. The dashed contours represent the expert delineations. These pictures point out some of the segmentation problems. (a) Darker area represents the seminal vesicles. (b) White zones are mainly due to calcifications.
Fig. 3
Fig. 3
Initialization: (a) ultrasound image with eight user-selected initial points; (b) initial mesh superimposed on the expert-defined surface.
Fig. 4
Fig. 4
Relocation of the mesh obtained from the eight initial points in the rectal wall area. (a) Rays, that cover an angle of about 120°, are thrown from the probe center and their intersection with the balloon boundary is searched (bright voxels). d is defined, along the ray that connects the probe center to the initial point p0init, as the distance between the balloon boundary and p0init. (b) Another axial slice. Mesh vertices that are in the balloon or at a distance less than min{d – 2, 30} from the balloon boundary are relocated at a distance of d –2 from this boundary along the rays that connect them to the center probe, towards the prostate.
Fig. 5
Fig. 5
Graph structure. (a) Vertical lines in blue at each vertex represent the set of voxels corresponding to a column of nodes in the graph. (b) Intra- and inter-column directed arcs.
Fig. 6
Fig. 6
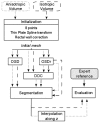
Summary of the algorithms. DDC, OSD, OSDr: Optimal Surface Detection followed by a regularization process. Dotted lines: anisotropic volume. Dashed lines: isotropic volumes.
Fig. 7
Fig. 7
DDC segmentations (black with gray edge) compared with manual delineations (white). Dashed contours correspond to the initialization. Columns: axial, sagittal, and coronal sections of five isotropic 3-D images. Rows: from 1 to 5, two good, two medium, and one low quality images.
Fig. 8
Fig. 8
OSDr segmentations (black with gray edge) compared with manual delineations (white). Dashed contours correspond to the initialization. Columns: axial, sagittal and coronal sections of the same isotropic 3-D images as Fig. 7.
Fig. 9
Fig. 9
Volume overlap obtained separately for each prostate specimen in the case of anisotropic (a) and isotropic (b) volumes. Each point corresponds to the mean of the volume overlap measures obtained by comparing the three segmentations produced from the different initial meshes to one expert delineation. Black rectangles represent 3-D images for which two references from the same expert are available.
Fig. 10
Fig. 10
Regional evaluation of the volume overlap produced by the algorithms separately for the base, the central part, and the apex.

References

    1. Cancer facts and figures. Am Cancer Soc. 2010. [Online]. Available: http://www.cancer.org.
    1. European Cancer Observatory [Online] Available: http://eu-cancer.iarc.fr.
    1. Damianou CA, Hynynen K, Fan X. Evaluation of accuracy of a theoretical model for predicting the necrosed tissue volume during focused ultrasound surgery. IEEE Trans Ultrason Ferroelectr Freq Control. 1995 Mar;42(2):182–187.
    1. Curiel L, Chavrier F, Gignoux B, Pichardo S, Chesnais S, Chapelon JY. Experimental evaluation of lesion prediction modelling in the presence of cavitation bubbles: Intended for high-intensity focused ultrasound prostate treatment. Med Biol Eng Comput. 2004 Jan;42(1):44–54. - PubMed
    1. Aarnink RG, Giesen RJ, Huynen AL, de la Rosette JJ, Debruyne FM, Wijkstra H. A practical clinical method for contour determination in ultrasonographic prostate images. Ultrasound Med Biol. 1994;20(8):705–717. - PubMed

Publication types

MeSH terms