. 2011 Feb 15;20(4):731-51.
doi: 10.1093/hmg/ddq519. Epub 2010 Nov 30.

miRNA-132 orchestrates chromatin remodeling and translational control of the circadian clock

Affiliations

miRNA-132 orchestrates chromatin remodeling and translational control of the circadian clock

Matías Alvarez-Saavedra et al. Hum Mol Genet. .

Abstract

Mammalian circadian rhythms are synchronized to the external time by daily resetting of the suprachiasmatic nucleus (SCN) in response to light. As the master circadian pacemaker, the SCN coordinates the timing of diverse cellular oscillators in multiple tissues. Aberrant regulation of clock timing is linked to numerous human conditions, including cancer, cardiovascular disease, obesity, various neurological disorders and the hereditary disorder familial advanced sleep phase syndrome. Additionally, mechanisms that underlie clock resetting factor into the sleep and physiological disturbances experienced by night-shift workers and travelers with jet lag. The Ca(2+)/cAMP response element-binding protein-regulated microRNA, miR-132, is induced by light within the SCN and attenuates its capacity to reset, or entrain, the clock. However, the specific targets that are regulated by miR-132 and underlie its effects on clock entrainment remained elusive until now. Here, we show that genes involved in chromatin remodeling (Mecp2, Ep300, Jarid1a) and translational control (Btg2, Paip2a) are direct targets of miR-132 in the mouse SCN. Coordinated regulation of these targets underlies miR-132-dependent modulation of Period gene expression and clock entrainment: the mPer1 and mPer2 promoters are bound to and transcriptionally activated by MeCP2, whereas PAIP2A and BTG2 suppress the translation of the PERIOD proteins by enhancing mRNA decay. We propose that miR-132 is selectively enriched for chromatin- and translation-associated target genes and is an orchestrator of chromatin remodeling and protein translation within the SCN clock, thereby fine-tuning clock entrainment. These findings will further our understanding of mechanisms governing clock entrainment and its involvement in human diseases.


Figures

Figure 1.
Figure 1.
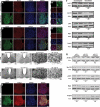
Computational analyses on functional annotations and in vitro validation of predicted targets of miR-132. (A) Box plot of the percentage distribution of predicted microRNA targets with putative chromatin-related functionality. The red dot shows miR-132 (5.5%) as an extreme point. (B) Box plot of the percentage distribution of predicted microRNA targets that are involved in translation-associated regulation. The red dot shows miR-132 (2.5%) well above the upper quartile (1.96%). (C) Table of miR-132 target sites within the 3′UTRs of murine Jarid1a, Mecp2, Ep300, Btg2 and Paip2a. Site conservation across species: M, mouse; H, human; R, rat; D, dog; O, opossum. Position of predicted miR-132 target sites within the 3′UTR (first nucleotide after the stop codon is denoted as position 1). Target site: alignment of the 3′UTR and miR-132. Nucleotides in purple and blue indicate complementarity. With the exception of Paip2a, mutant 3′UTRs were generated by deletion of the underlined nucleotides. For Paip2a, the underlined nucleotides were mutated via a C → G or G → C conversion. Predicted as a target of mmu-miR-132 based on the following target prediction websites: T, TargetScan; Z, MirZ; M, miRanda; P, PicTar. (D) miR-132 mediates 3′UTR-dependent repression of luciferase reporter activity via specific miR-132 target sites. Neuro-2a cells were transfected with luciferase reporter constructs carrying the full-length wild-type (WT) or mutant 3′UTRs of Btg2, Paip2a, Ep300, Jarid1a and Mecp2 in combination with synthetic miR-132 Mimic or a miRNA Mimic Negative Control. Renilla luciferase activity was used as an internal transfection control and was used to normalize raw firefly luciferase (FL) values. Control transfections using the backbone pGL3-Control vector (no 3′-UTR) in combination with miR-132 Mimic, miRNA Mimic Negative Control, or pcDNA3.1 empty vector were used to assess non-specific effects of miR-132 on a reporter construct that lacks a miR-132 target site, as well as potential effects of the Negative Control on luciferase activity. Values on the x-axis indicate relative luciferase activity = (UTRmimic/UTRneg)/[(pGL3-Cmimic)/(pGL3-Cneg)], where UTR and pGL3-C denote samples transfected with the 3′UTR reporter or the backbone pGL3-Control vector, respectively. Black bar denotes control transfection using pGL3-Control and is normalized to 1. Error bars represent the standard deviation from triplicate determinations of a single representative experiment. Consistent results were obtained from three independent experiments. In all cases, the relative luciferase activities of constructs bearing WT 3′UTRs were significantly reduced relative to control (black bar), and, with the exception of site #2 within the Jarid1a 3′UTR, mutation of the predicted target sites provided nearly complete rescue. *P< 0.05 versus WT 3′UTR (two-tailed Student's t-test and one-way ANOVA). (E) JARID1A, MeCP2, p300, BTG2 and PAIP2A protein levels in Neuro-2a cells following transient knockdown of endogenous miR-132 expression as determined by western blotting. Neuro-2a cells were transiently transfected with miR-132 hairpin inhibitors (lanes 1 and 2) to knock down miR-132 expression, or a microRNA hairpin inhibitor negative control (lanes 3 and 4). Twenty-four hours post-transfection, cells were harvested, and protein lysates were analyzed by western blotting. Actin expression served as the loading control. Values presented below the blot represent the mean relative abundance of the protein examined, normalized to actin expression, for each transfection condition. Three independent experiments were performed, and similar results were obtained.
Figure 2.
Figure 2.
miR-132 transgenic mice exhibit attenuated light-induced clock resetting of behavioral rhythms. (A) Conservation of miR-132 across species. Position of murine (mmu-)miR-132 gene on chromosome 11 (top). Alignment scores are indicated by green bars in the conservation track of the species listed. Red arrow immediately below the conservation tracks indicates the position of the miR-132 stem-loop precursor sequence. (Bottom) Transgene design. The pre-miR-132 sequence (green arrow) and the ECFP-PEST minigene cassette (blue arrow) were cloned in opposite orientations flanking a bidirectional tet-responsive promoter. CMV, minimal CMV promoter; TRE, tet-responsive element. (B, C) ECFP transgenic expression in the brains of Camk2α-tTA::miR-132 transgenic mice. (B) Sagittal and (C, C’) coronal SCN sections were processed for ECFP immunoreactivity using a goat polyclonal anti-GFP (green) antibody. In (B), sections were counterstained with the nuclear marker, DRAQ5 (pseudocolored in red). Scale bar = 1 mm. In (C, C’), sections were co-labeled for GFAP immunoreactivity (red) and counterstained with DRAQ5 (blue). Note the lack of co-localization in (C’). Scale bar = 50 μm (for C) and 10 μm (for C’). The abundance of (D) mature miR-132 and (E) mature miR-219 in the SCN of non-transgenic (black line) and tTA::miR-132 transgenic (green and red lines) mice was determined by ABI Taqman® miRNA qPCR analysis. Raw data are presented as fluorescence intensity versus number of PCR cycles. Two independent miR-132 founder lines, #2561 and #2570, were examined. SCN tissues from three mice were pooled for each sample, from which quadruplicate determinations were made. Quantitation of (D’) miR-132 and (E’) miR-219 abundance from (D) and (E), respectively. Data are quantified and presented as relative fold change, in which values for non-transgenic controls are set arbitrarily as 1. Error bars denote SEM of quadruplicate determinations. ***P< 0.001, n.s. = non-significant versus non-transgenic control (one-way ANOVA). (F) Assessment of Dox-mediated transgene silencing in tTA::miR-132 mice. Adult mice were fed Dox-containing rodent chow (6 mg/g food) for 28 days and then returned to a regular diet lacking Dox for an additional 14 days. Three treatment groups were examined for ECFP transgene expression: (top) Dox-naïve mice (−Dox) and Dox-fed mice that were killed (middle) 1 day after cessation of Dox treatment (+Dox 28 days/−Dox 1 day), or (bottom) 14 days after cessation of Dox treatment (+Dox 28 days /−Dox 14 days). Brain sections were processed for ECFP (green) immunoreactivity using a polyclonal anti-GFP antibody, and counterstained with DRAQ5 (pseudocolored in red). Scale bar = 100 μm. n = 5 mice per condition. (G, top panels) Representative double-plotted actograms of wheel-running activity of non-transgenic (left) and tTA::miR-132 transgenic (right) mice maintained under doxycycline-free conditions. Mice were stably entrained to a fixed 12 h:12 h light–dark (LD) cycle prior to release into constant darkness (DD). After 2 weeks in DD, mice received a single, 15-min light pulse of 40 lux intensity (yellow circle) at CT 15, and returned to DD. After 15 days, mice received a second light pulse of higher intensity (red circle: 15 min, 400 lux) at CT 15, and returned to DD for an additional 2 weeks. Note that tTA::miR-132 transgenic mice exhibit smaller light-induced phase shifts at both light intensities, compared with non-transgenic controls. Periods of darkness are shaded in gray. Activity onsets are indicated by blue lines. The x-axis indicates the Zeitgeber (ZT) time of the initial 12 h:12 h light–dark cycle (100 lux during the L portion). The y-axis indicates the nth day of the study. Missing activity data on day 17 (green bars) were due to computer malfunction. (G, bottom panels) Representative double-plotted actograms of non-transgenic (left) and tTA::miR-132 transgenic (right) mice that had been maintained on a Dox diet (6 mg/g food) during adulthood for 4 weeks in order to ‘turn off' miR-132 transgene expression. Mice were returned to regular, Dox-free rodent chow 1 week prior to exposure to a single, 15-min light pulse of 40 lux intensity (yellow circle) at CT 15. Note that doxycycline treatment restored the magnitude of light-induced phase shifts of tTA::miR-132 transgenic mice to the level of non-transgenic controls. (+Dox) Period of Dox feeding; (−Dox) Dox-free conditions. (G’) Quantitation of the effects of miR-132 transgenic expression and doxycycline treatment on CT 15 light-induced phase shifts. Values are presented as mean ± SEM phase shift (in min). Negative values indicate phase delays. n = 10–14 per group. *P< 0.05 versus same-treated non-transgenic control (two-tailed Student's t-test).
Figure 3.
Figure 3.
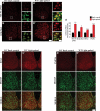
miR-132 regulates the expression of MeCP2, p300, JARID1A, BTG2 and PAIP2A in the SCN. MeCP2, BTG2 and PAIP2A protein expression in the SCN of tTA::miR-132 transgenic mice and non-transgenic controls at CT 16. SCN tissue from non-transgenic (top row) and tTA::miR-132 transgenic (bottom row) mice was harvested at CT 16 and analyzed for expression of (A) MeCP2, (B) BTG2 and (E) PAIP2A by indirect immunofluorescence (red). Transgenic expression was confirmed by co-detection of ECFP (green). Sections were counterstained with the nuclear marker DRAQ5 (blue). Merged images are presented in the rightmost columns. Scale bars = 50 μm. (A’, B’) Expression of (A’) MeCP2 and (B’) BTG2 in the retinorecipient region of the SCN, the ventrolateral aspect, is presented in higher magnification. Note the heterochromatic distribution of MeCP2 as well as the cytoplasmic distribution of BTG2. Scale bars = 5 μm. Immunohistochemical detection of (C) p300 and (D) JARID1A protein expression in the SCN of tTA::miR-132 transgenic mice and non-transgenic controls at CT 16. Scale bars = 100 μm. Expression of (C’) p300 and (D’) JARID1A in the ventrolateral SCN is given in higher magnification images. Scale bars = 20 μm. For (A) to (E), n = 6 mice per genotype and representative images were chosen. (F) MeCP2, BTG2, p300, JARID1A and PAIP2A protein expression in the SCN of tTA::miR-132 transgenic mice (lanes 3 and 4) and non-transgenic controls (lanes 1 and 2) as determined by western blotting. Actin expression served as loading control. Values presented below each blot represent the mean relative abundance of the protein examined, normalized to actin expression, for each genotype. n = 4 mice per genotype, grouped in pools of two. The experiment was repeated three times with separate pooled samples, and similar results were obtained. (G) The effect of antagomir-mediated knockdown of endogenous miR-132 on the expression of MeCP2, BTG2, p300, JARID1A and PAIP2A in the murine SCN. C57Bl/6J mice were dark-adapted for 2 days and then infused with antagomirs (100 μm, 3 μl) against miR-132, miR-1 or miR-219 into the lateral ventricles at CT 15. The following day, mice received a brief light pulse (15 min, 100 lux) at CT 15, and 8 h later (CT23) SCN tissue was harvested for analysis of protein expression by western blotting. Actin expression served as the loading control. Values presented below each blot represent the mean relative abundance of the protein examined, normalized to actin expression, for each genotype. n = 10 mice per treatment condition, grouped in pools of two.
Figure 4.
Figure 4.
miR-132 targets and their downstream effectors are light-responsive. Light acutely induces the phosphorylation of MeCP2 at Ser421 (pS421) and trimethylation of histone H3 at lysine 4 (H3K4Me3) in the SCN. C57Bl/6 (WT) mice received a brief light pulse (15 min, 40 lux) at CT 15. Tissue was harvested 30 min after onset of light treatment and analyzed for expression of (A’) MeCP2 pS421 (red) or (B’) H3K4Me3 (red) by indirect immunofluorescence. Sections were counterstained with the nuclear marker, DRAQ5 (pseudocolored in green). (A, B) Dark control mice were not exposed to light but were killed at the same CT. For each condition, the boxed region in the left panel (scale bars = 50 μm) is presented in higher magnification in the right-most panels (scale bars = 5 μm): (top right) MeCP2 pS421 or H3K4Me3 immunoreactivity only; (bottom right) merged image of MeCP2 pS421 or H3K4Me3 immunoreactivity in combination with DRAQ5. BTG2 and PAIP2A protein levels in the SCN are induced in response to light. C57Bl/6 mice received a brief light pulse (15 min, 40 lux) at CT 15 and killed 2 h later for analysis of (C’) BTG2 (red) and (D’) PAIP2A expression (red) by indirect immunofluorescence. (C, D) Dark control mice were not exposed to light but were killed at the same CT. Scale bars = 50 μm. (E) Quantitation of light-induced expression of pS421 MeCP2, H3K4Me3, BTG2 and PAIP2A in the SCN. Values on the y-axis represent arbitrary mean fluorescence intensity for individual cells (in the case of pS421 MeCP2 and H3K4Me3) or for the unilateral SCN (in the case of BTG2 and PAIP2A). Values are presented as mean ± SEM. n = 5 mice per condition. *P< 0.05, ***P< 0.001 versus dark control (two-tailed Student's t-test).
Figure 5.
Figure 5.
miR-132 overexpression in the SCN dampens PER1 protein rhythms and suppresses light-induced expression of PER1 and PER2. Rhythms of PER1, but not PER2, expression are dampened in the SCN of tTA::miR-132 mice. SCN tissue was harvested from tTA::miR-132 mice (bottom row) and non-transgenic controls (top row) at defined CT across a full circadian cycle, and analyzed for (A) PER1 and (B) PER2 expression by immunohistochemistry. Scale bars = 100 μm. Induction of PER1 and PER2 expression in the SCN in response to photic stimulation is attenuated in tTA::miR-132 mice. Non-transgenic and tTA::miR-132 mice received a brief light pulse (15 min, 40 lux) at CT 15 and SCN tissue was harvested 4 h later for determination of (C) PER1 and (D) PER2 levels by immunohistochemistry. Dark control mice were not exposed to light but were killed at the same CT. Scale bars = 50 μm. Quantitation of (E) PER1 and (F) PER2 rhythms from (A) and (B), respectively. Values on the y-axis represent the mean intensity of the unilateral SCN, given in arbitrary units. Quantitation of light-inducible (G) PER1 and (H) PER2 expression from (C) and (D), respectively. Values on the y-axis indicate the number of PER1- or PER2-immunoreactive nuclei in the bilateral SCN. Values are presented as mean ± SEM. n = 4–6 mice per group. *P< 0.05, **P< 0.01 (Fisher's LSD).
Figure 6.
Figure 6.
MeCP2 binds to elements within the mPer1 and mPer2 gene promoters and activates their transcription. Schematic representation of the (A) mPer1 and (B) mPer2 upstream regulatory elements. The mPer1 gene is composed of three canonical E-boxes (red box), one canonical CRE site (yellow box) and two CpG islands of ∼300 bp each (blue box). The mPer2 gene is composed of six non-canonical E-boxes (hatched red box), two non-canonical CRE sites (hatched yellow box) and one CpG island of ∼400 bp (blue box). Numbers below each box represent the genomic location relative to the TSS (+1; arrows). ChIP analysis for binding of MeCP2 (left) and H3K4Me3 (right) within the (C) mPer1 and (D) mPer2 promoters. Regions analyzed include (C) the CpG#1 (position −3130), CRE (position −1724), E-box#3 (position −1254) and E-box#1 (position −145) of the mPer1 gene, and (D) CRE#1 (position −1568), CRE#2 (position −2658), CpG (position −57) and E-box#1 (position +11) of the mPer2 gene. ChIP assays were performed with chromatin harvested from NIH-3T3 cells 36 h following transient transfection with the MeCP2-e1-myc construct. Values on the y-axis indicate the enrichment of the immunoprecipitated (IP) DNA encompassing the specified region relative to an input control and are presented as mean ± SEM relative enrichment. Immunoprecipitation using an anti-rabbit IgG served as the negative control. Triplicate determinations from three independent experiments were made. **P< 0.01, ***P< 0.001, n.s. = non-significant versus IgG (two-tailed Student's t-test). (E) Overexpression of the MeCP2-e1 isoform stimulates PER1 and PER2 expression in a CREB-dependent manner. Neuro-2a cells were transiently transfected with constructs encoding MeCP2-e1-myc (lanes 3 and 4), dominant-negative K-CREB (lanes 5 and 6) or both (lanes 7 and 8), and PER1 (top row) and PER2 (middle row) protein levels were examined 36 h later by western blotting. Transfection with empty vector pcDNA3 (lanes 1 and 2) served as the negative control. Actin expression served as the loading control. Values presented below each blot represent the mean relative abundance of the protein examined, normalized to actin expression, for each genotype. n = 3 per condition per experiment. The experiment was repeated three times and similar results were obtained.
Figure 7.
Figure 7.
Paip2a−/− mice exhibit enhanced inducibility of PER1 and PER2 expression in the SCN in response to light and elevated basal expression of PER1 during the circadian night. (A) The absence of PAIP2A protein in the brains of Paip2a−/− mice. Brain extracts from wild-type (WT), Paip2a−/− (PAIP2A KO), Paip2b−/− (PAIP2B KO) and Paip2a−/−Paip2b−/− (double knockout: DKO) mice were analyzed for PAIP2A, PAIP2B and poly(A)-binding protein (PABP) expression by western blotting. Expression of β-actin was used as a loading control. Expression of PER1 and PER2 in the SCN of wild-type and Paip2a−/− mice from the late subjective day to the mid-subjective night. SCN tissue was harvested from wild-type (top row) and Paip2a−/− mice (bottom row) at CT 10, 12, 14, 16 and 18, and analyzed for (B) PER1 and (C) PER2 expression by immunohistochemistry. Scale bars = 100 μm. Induction of PER1 and PER2 expression in the SCN in response to photic stimulation is potentiated in the absence of PAIP2A. Wild-type and Paip2a−/− mice received a brief light pulse (15 min, 40 lux) at CT 15 and SCN tissue was harvested 4 h later for determination of (D) PER1 and (E) PER2 levels by immunohistochemistry. Dark control mice were not exposed to light but were killed at the same CT. Scale bars = 50 μm. Quantitation of (F) PER1 and (G) PER2 protein abundance from (B) and (C), respectively. Values on the y-axis represent the mean intensity of the unilateral SCN, given in arbitrary units. Quantitation of light-inducible (H) PER1 and (I) PER2 expression from (D) and (E), respectively. Values on the y-axis indicate the number of PER1- or PER2-immunoreactive nuclei in the bilateral SCN. Values are presented as mean ± SEM. n = 4–6 mice per group. *P< 0.05, **P< 0.01 (Fisher's LSD).
Figure 8.
Figure 8.
PAIP2A and BTG2 overexpression increases the turnover of Per1 and Per2 transcripts. Transcriptional chase experiments showing levels of (A) Per1 and (B) Per2 reporters in the presence of ectopically expressed PAIP2A or BTG2. HEK293-TOF cells were transfected with either pBI-Per1 or pBI-Per2 reporter plasmids, together with PAIP2A- or BTG2-expressing constructs or empty plasmid (pcDNA). Levels of (A) Per1 and (B) Per2 reporter transcripts were determined by qRT-PCR at indicated times (x-axis: in hr) after addition of doxycycline (2 μg/ml). Values on the y-axis indicate normalized relative abundance, where, for each transfection condition, the level of reporter expression at time = 0 h was set arbitrarily at 1. Values are normalized to 18S rRNA expression. Levels of endogenous (C) Per1 and (D) Per2 transcripts following induction of PAIP2A or BTG2 expression. Neuro-2a cells were transfected with tet-inducible PAIP2A (pBI-PAIP2A) or BTG2 (pBI-BTG2) expression plasmids, or an empty plasmid (pBI-ECFP), together with the Tet-OFF transcriptional activator. Cells were maintained for 24 h in medium containing doxycycline (200 ng/ml), and then transferred to Dox-free medium for an additional 9 h to induce PAIP2A or BTG2 expression. Actinomycin D (5 μg/ml) was subsequently added to the culture medium. Levels of (C) Per1 and (D) Per2 transcripts were determined by qRT-PCR at indicated times (x-axis: in hr) after addition of actinomycin D. Values on the y-axis indicate normalized relative abundance, where, for each transfection condition, the level of Per1/Per2 expression at time = 0 h was set arbitrarily at 1. Values are normalized to 18S rRNA expression. Error bars represent the standard deviation from triplicate determinations of a single representative experiment. Consistent results were obtained from three independent experiments. *P< 0.05 versus empty vector control (Fisher's LSD).
Figure 9.
Figure 9.
Proposed model of light-induced molecular waves of clock entrainment. (I) Nocturnal light exposure triggers rapid, post-translational events in SCN neurons that promote remodeling of chromatin to a transcriptionally permissive state. For instance, a brief light pulse elicits the phosphorylation (P) of MeCP2 at Ser421, trimethylation (M) of histone H3 at lysine 4 (red star) and acetylation (A) of histone H2A.Z at lysine residues K4, K7 and K11 (purple circle). (IIa) As a result, transcription factors (TFs) and their co-modulators (e.g. MeCP2 and EP300) gain access to gene promoters and transactivate a number of light-responsive genes, including Per1, Per2, Btg2 (29), miR-132 (19) and possibly Paip2a. (IIb) Subsequent mRNA translation leads to increased protein abundance of PER1, PER2, BTG2 and PAIP2A. PABP physically associates with the polyA tails of the transcripts and facilitates translation. (IIb’) Meanwhile, the primary miR-132 transcript undergoes a series of processing steps, including sequential proteolytic cleavages to generate the pre-miR-132 stem loop and the miRNA duplex, export of pre-miR-132 to the cytoplasm and incorporation of the mature strand (denoted by the red asterisk) into the RNA-induced silencing complex (RISC). (III) As the levels of BTG2 and PAIP2A proteins increase, further translation of Per1 and Per2 transcripts is inhibited. PAIP2A competes with the polyA tail for binding to PABP, thus inhibiting PABP-dependent facilitation of translation; moreover, PAIP2A may promote transcript degradation (62). BTG2 can physically associate with the CAF1/CCR4 deadenylase complex and enhances CAF1/CCR4-mediated deadenylation and mRNA decay (39). (IV) With rising levels of mature miR-132, miRNA-mediated translational repression of miR-132 targets (ep300, mecp2, jarid1a, btg2, paip2a) ensues, restoring homeostasis to those processes that were triggered by light.

References

    1. Reppert S.M., Weaver D.R. Coordination of circadian timing in mammals. Nature. 2002;418:935–941. doi:10.1038/nature00965. - DOI - PubMed
    1. Toh K.L., Jones C.R., He Y., Eide E.J., Hinz W.A., Virshup D.M., Ptácek L.J., Fu Y.H. An hPer2 phosphorylation site mutation in familial advanced sleep phase syndrome. Science. 2001;291:1040–1043. doi:10.1126/science.1057499. - DOI - PubMed
    1. Xu Y., Padiath Q.S., Shapiro R.E., Jones C.R., Wu S.C., Saigoh N., Saigoh K., Ptácek L.J., Fu Y.H. Functional consequences of a CKIdelta mutation causing familial advanced sleep phase syndrome. Nature. 2005;434:640–644. doi:10.1038/nature03453. - DOI - PubMed
    1. Ebisawa T., Uchiyama M., Kajimura N., Mishima K., Kamei Y., Katoh M., Watanabe T., Sekimoto M., Shibui K., Kim K., et al. Association of structural polymorphisms in the human period3 gene with delayed sleep phase syndrome. EMBO Rep. 2001;2:342–346. doi:10.1093/embo-reports/kve070. - DOI - PMC - PubMed
    1. Panda S., Antoch M.P., Miller B.H., Su A.I., Schook A.B., Straume M., Schultz P.G., Kay S.A., Takahashi J.S., Hogenesch J.B. Coordinated transcription of key pathways in the mouse by the circadian clock. Cell. 2002;109:307–220. doi:10.1016/S0092-8674(02)00722-5. - DOI - PubMed

Publication types

MeSH terms