. 2011 Jan 15;22(2):165-78.
doi: 10.1091/mbc.E10-06-0500. Epub 2010 Nov 30.

Autophagy facilitates glycolysis during Ras-mediated oncogenic transformation

Affiliations

Autophagy facilitates glycolysis during Ras-mediated oncogenic transformation

Rebecca Lock et al. Mol Biol Cell. .

Abstract

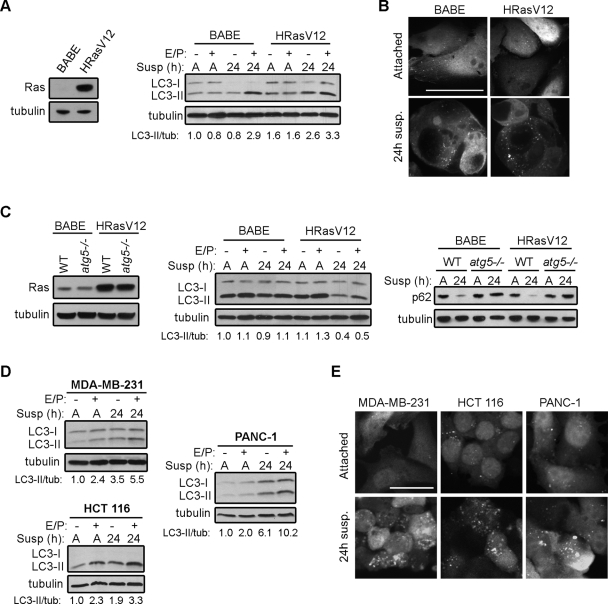
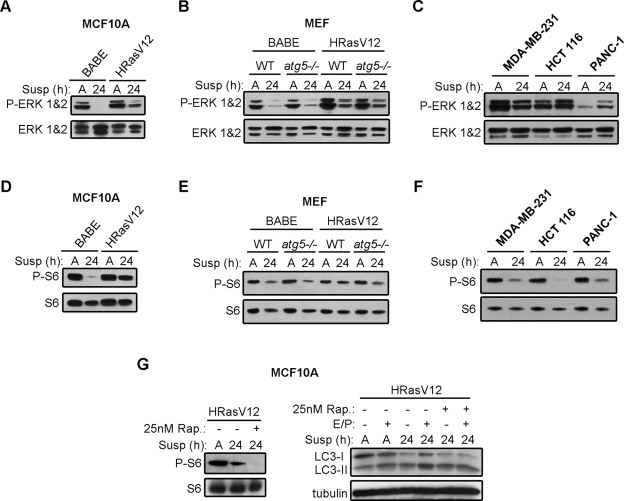
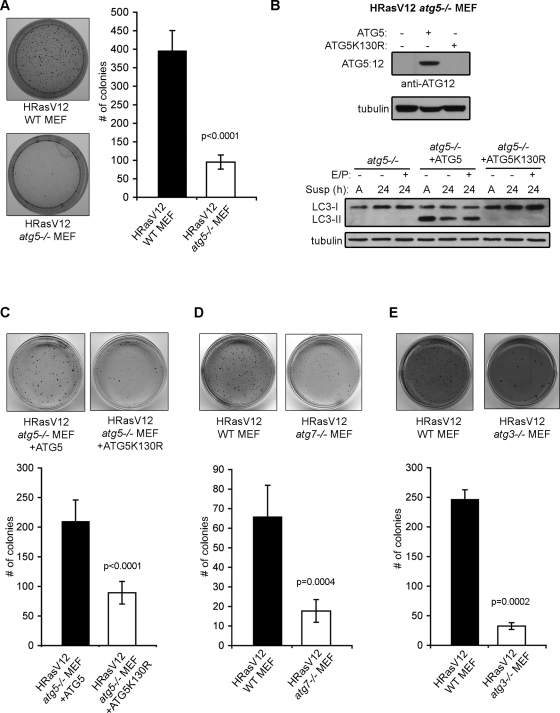
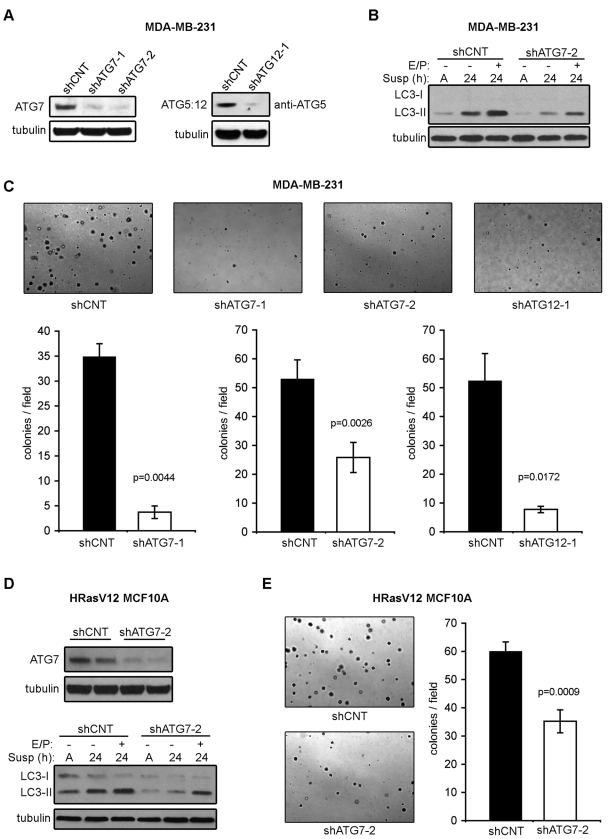
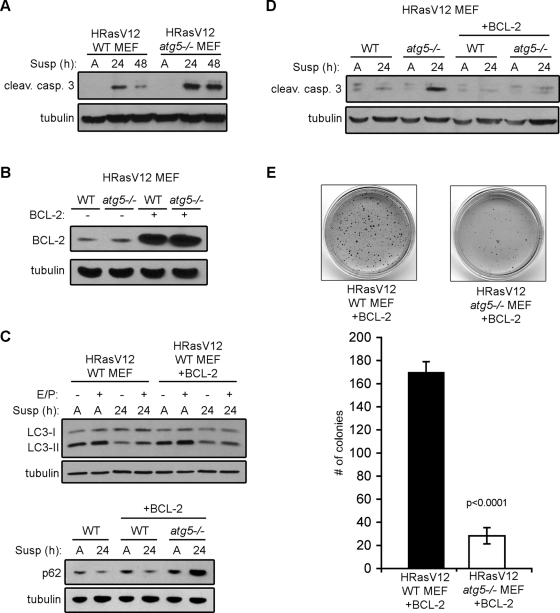
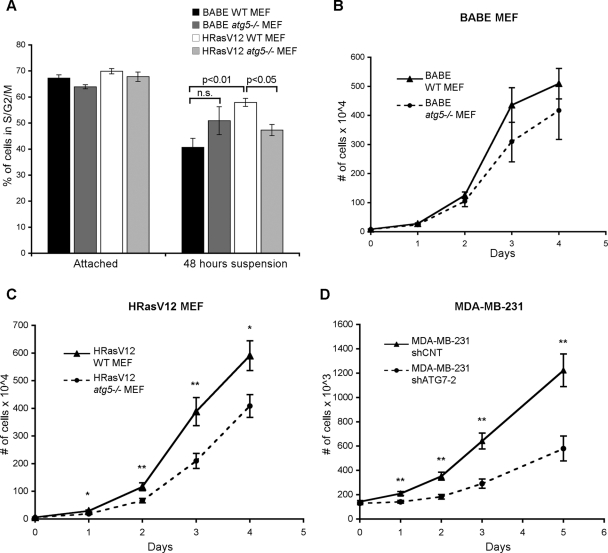
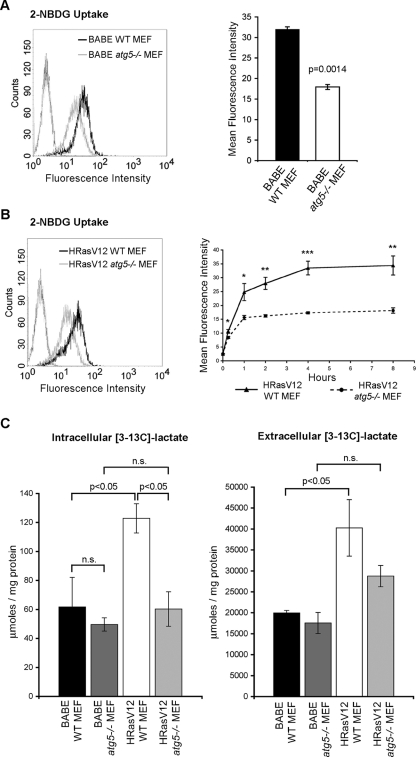
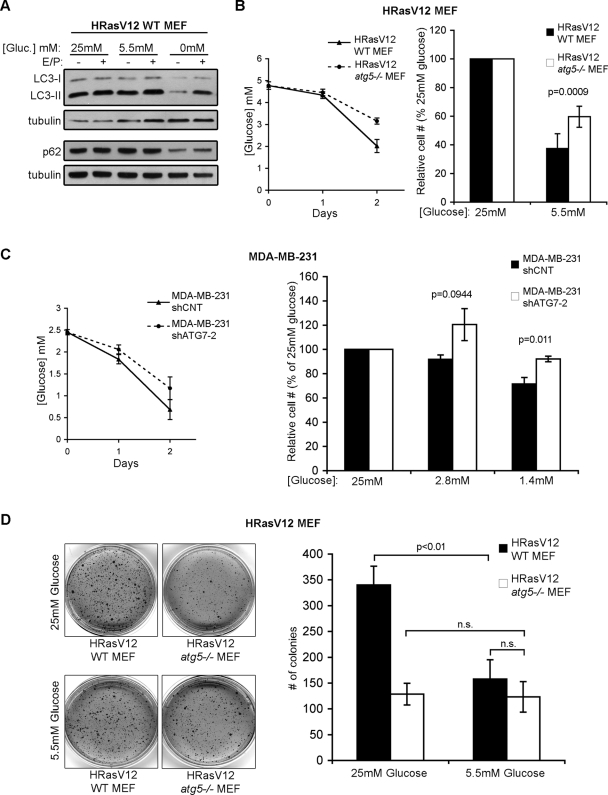
The protumorigenic functions for autophagy are largely attributed to its ability to promote cancer cell survival in response to diverse stresses. Here we demonstrate an unexpected connection between autophagy and glucose metabolism that facilitates adhesion-independent transformation driven by a strong oncogenic insult-mutationally active Ras. In cells ectopically expressing oncogenic H-Ras as well as human cancer cell lines harboring endogenous K-Ras mutations, autophagy is induced following extracellular matrix detachment. Inhibiting autophagy due to the genetic deletion or RNA interference-mediated depletion of multiple autophagy regulators attenuates Ras-mediated adhesion-independent transformation and proliferation as well as reduces glycolytic capacity. Furthermore, in contrast to autophagy-competent cells, both proliferation and transformation in autophagy-deficient cells expressing oncogenic Ras are insensitive to reductions in glucose availability. Overall, increased glycolysis in autophagy-competent cells facilitates Ras-mediated adhesion-independent transformation, suggesting a unique mechanism by which autophagy may promote Ras-driven tumor growth in specific metabolic contexts.


Figures

FIGURE 1:
FIGURE 1:
Oncogenic Ras does not suppress ECM detachment-induced autophagy. (A) Left: Ras expression in MCF10A cells expressing empty vector (BABE) or H-RasV12. Right: BABE and H-RasV12 MCF10A cells were grown attached (A) or suspended (susp) for the indicated times in the presence or absence of E64d and pepstatin A (E/P), lysed, and subjected to immunoblotting with antibodies against LC3 and tubulin. (B) GFP-LC3 puncta in MCF10A cells expressing empty vector (BABE) or H-RasV12 grown attached or suspended for 24 h. (C) Left: Ras expression in atg5+/+ (WT) and atg5−/− MEFs expressing empty vector or H-RasV12. Center: atg5+/+ (WT) MEFs expressing empty vector (BABE) and H-RasV12 were growth attached (A) or suspended (susp) for 24 h in the presence or absence of E64d and pepstatin A (E/P), lysed, and subjected to immunoblotting with antibodies against LC3 and tubulin. Right: atg5+/+ (WT) and atg5−/− MEFs expressing H-RasV12 or empty vector (BABE) were grown attached (A) or suspended (susp) for 24 h, lysed, and subjected to immunoblotting with antibodies against p62 and tubulin. (D) MDA-MB-231, HCT 116, and PANC-1 cells were grown attached (A) or suspended (susp) for 24 h in the presence or absence of E64d and pepstatin A (E/P) and subjected to immunoblotting with antibodies against LC3 and tubulin. (E) GFP-LC3 puncta in MDA-MB-231, HCT 116, and PANC-1 cells that were grown attached or detached for 24 h. Bar, 25 μm.
FIGURE 2:
FIGURE 2:
Effects of ECM detachment on MAPK and mTORC1 signaling in Ras-transformed cells. (A–C) Empty vector (BABE) and H-RasV12–expressing MCF10A cells (A), atg5+/+ (WT) and atg5−/− MEFs (B), and K-Ras mutant carcinoma cell lines (C) were grown attached (A) or suspended (susp) for the indicated times and subjected to immunoblotting with antibodies against phosphorylated ERK1/2 and total ERK1/2 protein. (D–F) Empty vector (BABE) and H-RasV12–expressing MCF10A cells (D), atg5+/+ (WT) and atg5−/− MEFs (E), and K-Ras mutant carcinoma cell lines (F) were grown attached (A) or suspended (susp) for the indicated times and subjected to immunoblotting with antibodies against phosphorylated S6 and total ribosomal S6 protein. (G) H-RasV12 MCF10A cells were grown attached (A) or suspended (susp) for 24 h in the presence or absence of E64d and pepstatin A (E/P) and subjected to immunoblotting with antibodies against phosphorylated S6, S6, LC3, and tubulin. When indicated, cells were treated with 25 nM rapamycin for 5 h before harvest.
FIGURE 3:
FIGURE 3:
Decreased anchorage-independent growth in autophagy-deficient MEFs expressing H-RasV12. (A) Soft agar colony formation in H-RasV12 expressing atg5+/+ (WT) and atg5/ MEFs. (B) atg5/ MEFs reconstituted with wild-type murine ATG5 or ATG5 K130R were subjected to immunoblotting with antibodies against ATG12 (to detect the ATG12-ATG5 complex) and tubulin. As indicated, cells were grown attached (A) or suspended (susp) for 24 h in the presence or absence of E64d and pepstatin A (E/P) and subjected to immunoblotting with antibodies against LC3 and tubulin as a loading control. (C) Soft agar colony formation in H-RasV12–expressing atg5/ MEFs expressing ATG5 or ATG5K130R. (D and E) Soft agar colony formation in H-RasV12 expressing wild-type (WT), atg7/, and atg3/ MEFs. The above results represent the mean ± SEM from three or more independent experiments. P value was calculated using Student's t test.
FIGURE 4:
FIGURE 4:
Effects of ATG knockdown on adhesion-independent transformation in MDA-MB-231 cells and H-RasV12 MCF10A cells. (A) MDA-MB-231 cells transduced with lentiviral vectors encoding shRNAs against the indicated ATGs (shATGs) were subjected to immunoblotting with antibodies against ATG7, ATG5 (to detect ATG12–ATG5 complex), and tubulin. (B) MDA-MB-231 cells expressing shATG7-2 or shCNT were grown attached (A) or suspended (susp) for the indicated times in the presence or absence of E64d and pepstatin A (E/P) and subjected to immunoblotting with antibodies against LC3 and tubulin. (C) Representative images and quantification of soft agar colony formation in MDA-MB-231 cells expressing the indicated shATGs. (D) H-RasV12 MCF10A cells expressing shCNT or shATG7-2 were grown attached (A) or suspended (susp) for the indicated times in the presence or absence of E64d and pepstatin A (E/P) and subjected to immunoblotting with antibodies against ATG7, LC3, and tubulin. (E) Representative images and quantification of soft agar colony formation in H-RasV12 MCF10A cells expressing shCNT or shATG7-2. The above results represent the mean ± SEM from three or more independent experiments. P value was calculated using Student's t test.
FIGURE 5:
FIGURE 5:
Bcl-2 inhibition of apoptosis is not sufficient to restore anchorage-independent growth in autophagy-deficient cells. (A) H-RasV12 expressing atg5+/+ (WT) and atg5/ MEFs were grown attached (A) or suspended (susp) for the indicated times and subjected to immunoblotting with antibodies against cleaved capase-3 and tubulin. (B) Bcl-2 expression levels in H-RasV12 atg5+/+ (WT) and atg5/ MEFs in the presence or absence of stable ectopic expression of Bcl-2. (C) The indicated cell types were grown attached (A) or suspended (susp) for 24 h with or without E64d and pepstatin A (E/P) and subjected to immunoblotting with antibodies against LC3, p62, and tubulin. (D) The indicated cell types, all expressing H-RasV12, were grown attached (A) or suspended for 24 h and subjected to immunoblotting with antibodies against cleaved caspase-3 and tubulin. (E) Soft agar colony formation of H-RasV12 atg5+/+ (WT) and atg5/ MEFs stably expressing BCL-2. Results represent the mean ± SEM from three independent experiments. P value was calculated using Student's t test.
FIGURE 6:
FIGURE 6:
Reduced proliferation upon autophagy inhibition in H-RasV12 expressing MEFs and MDA-MB-231 cells. (A) The indicated cell types were grown attached or subjected to ECM detachment for 48 h and analyzed by flow cytometry to quantify the percentage of cells with DNA content corresponding to the S and G2/M (S + G2/M) phases of the cell cycle. Results are the mean ± SEM from three or more independent experiments. Statistical significance was calculated using ANOVA. (B) Proliferation curves of empty vector (BABE) atg5+/+ (WT) and atg5/ MEFs cultured in attached, nutrient-rich conditions. (C) Proliferation curves of H-RasV12 expressing atg5+/+ (WT) and atg5/ MEFs in attached, nutrient-rich conditions. (D) Proliferation curves of MDA-MB-231 cells expressing shCNT or shATG7-2 in attached, nutrient-rich conditions. For (B–D), p value was calculated at each time point using Student's t test, with statistical significance indicated as follows: *p < 0.05; **p < 0.01.
FIGURE 7:
FIGURE 7:
Reduced glucose metabolism in autophagy-deficient MEFs. (A) Levels of glucose uptake (2-NBDG uptake, mean fluorescence intensity) in empty vector (BABE) atg5+/+ (WT) and atg5/ MEFs following 2.5 h incubation. Statistical significance was calculated using Student's t test. (B) 2-NBDG uptake (mean fluorescence intensity) after 1 h (left histogram) and over an 8-h time course (right graph) in H-RasV12 expressing atg5+/+ (WT) and atg5/ MEFs. P value was calculated at each time point using Student's t test, with statistical significance indicated as follows: *p < 0.05; **p < 0.01; ***p < 0.001. (C) Levels of 13C-labeled intracellular lactate and extracellular lactate detected by NMR following 24 h of labeling with [1-13C]glucose. Results represent the mean ± SEM from three independent experiments. Statistical significance was calculated using ANOVA.
FIGURE 8:
FIGURE 8:
The proliferation and transformation of autophagy-competent cells are more sensitive to diminished glucose availability than autophagy-deficient cells. (A) H-RasV12 expressing WT MEFs were cultured in media containing 25 mM or 5.5 mM glucose for 48 h or in the complete absence of glucose (0 mM) for 9 h. E64d and pepstatin A (E/P) were added when indicated to measure autophagic flux. Cells were lysed and subjected to immunoblotting with antibodies against LC3, p62, and tubulin as a loading control. (B) Left: Media glucose levels from cultures of H-RasV12 atg5+/+ (WT) and atg5/ MEFs grown in 5.5 mM glucose over 2 d. Right: Relative percentage of viable cells in 5.5 mM glucose compared with 25 mM glucose following 4 d of culture. (C) Left: Media glucose levels from cultures of MDA-MB-231 cells expressing shCNT or shATG7-2 grown in 2.8 mM glucose over 2 d. Right: Relative percentage of viable cells grown in 2.8 mM and 1.4 mM glucose media compared with 25 mM glucose following 3 d of growth. (D) Soft agar colony formation of H-RasV12 expressing atg5+/+ (WT) and atg5/ MEFs in 25 and 5.5 mM glucose conditions. Results represent the mean ± SEM from four independent experiments. Statistical significance was calculated using ANOVA.

Comment in

  • Ras, autophagy and glycolysis.
    Lock R, Debnath J. Lock R, et al. Cell Cycle. 2011 May 15;10(10):1516-7. doi: 10.4161/cc.10.10.15434. Epub 2011 May 15. Cell Cycle. 2011. PMID: 21467842 No abstract available.

References

    1. Aki T, Yamaguchi K, Fujimiya T, Mizukami Y. Phosphoinositide 3-kinase accelerates autophagic cell death during glucose deprivation in the rat cardiomyocyte-derived cell line H9c2. Oncogene. 2003;22:8529–8535. - PubMed
    1. Berry DL, Baehrecke EH. Growth arrest and autophagy are required for salivary gland cell degradation in Drosophila. Cell. 2007;131:1137–1148. - PMC - PubMed
    1. Chen N, Debnath J. Autophagy and tumorigenesis. FEBS Lett. 2010;584:1427–1435. - PMC - PubMed
    1. Chiaradonna F, Sacco E, Manzoni R, Giorgio M, Vanoni M, Alberghina L. Ras-dependent carbon metabolism and transformation in mouse fibroblasts. Oncogene. 2006;25:5391–5404. - PubMed
    1. Dai C, Whitesell L, Rogers AB, Lindquist S. Heat shock factor 1 is a powerful multifaceted modifier of carcinogenesis. Cell. 2007;130:1005–1018. - PMC - PubMed

Publication types

MeSH terms

Substances