. 2011 Jan 15;22(2):202-15.
doi: 10.1091/mbc.E10-05-0394. Epub 2010 Nov 30.

The kinesin KIF9 and reggie/flotillin proteins regulate matrix degradation by macrophage podosomes

Affiliations

The kinesin KIF9 and reggie/flotillin proteins regulate matrix degradation by macrophage podosomes

Susanne Cornfine et al. Mol Biol Cell. .

Abstract

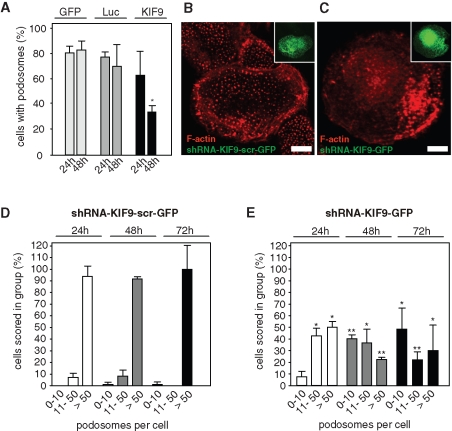
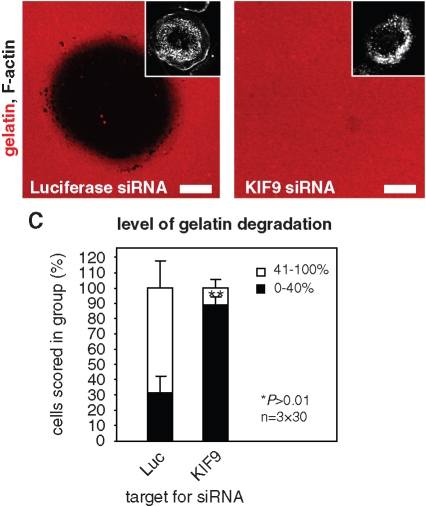
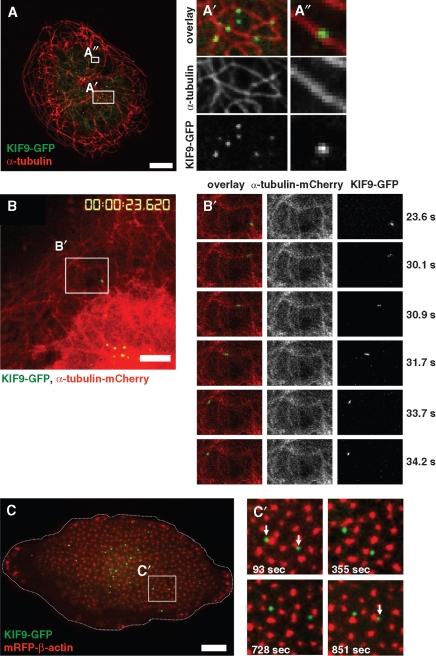
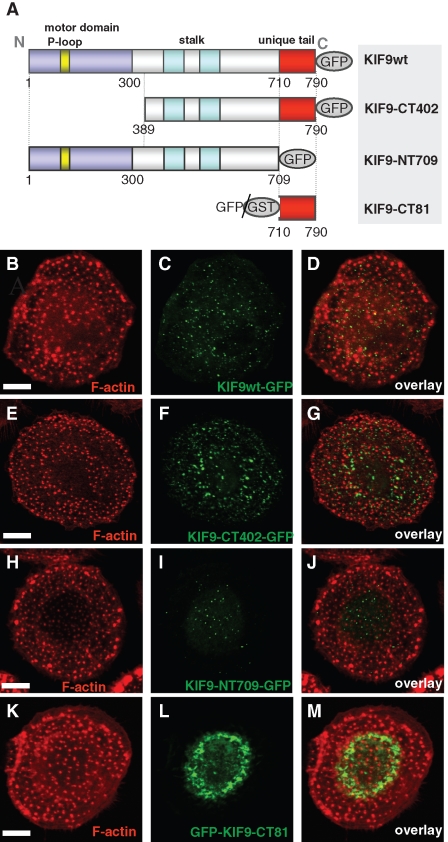
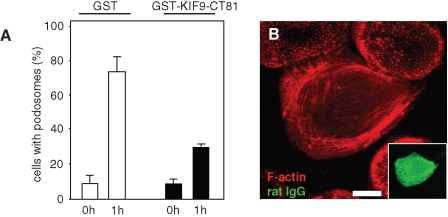
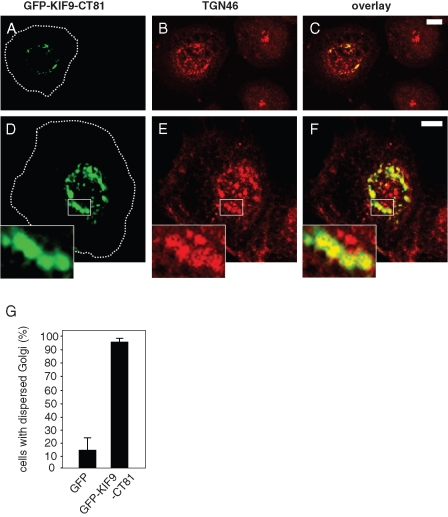
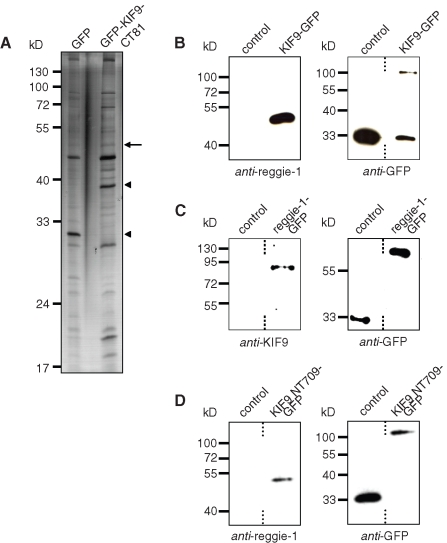
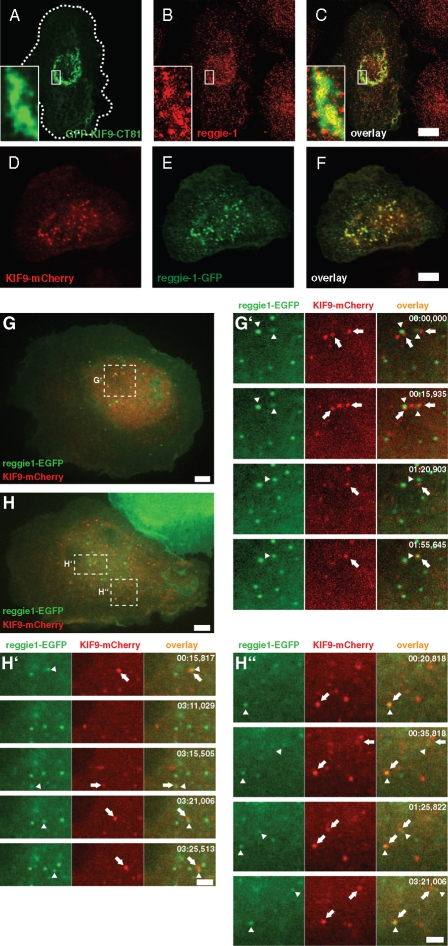
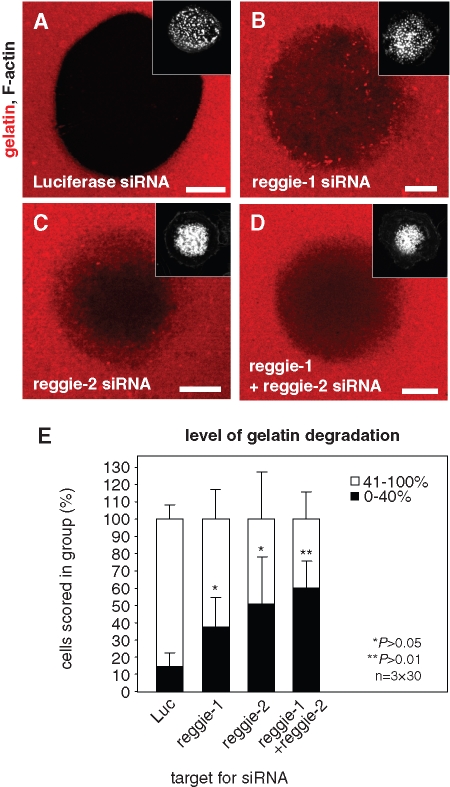
Podosomes are actin-based matrix contacts in a variety of cell types, most notably monocytic cells, and are characterized by their ability to lyse extracellular matrix material. Besides their dependence on actin regulation, podosomes are also influenced by microtubules and microtubule-dependent transport processes. Here we describe a novel role for KIF9, a previously little-characterized member of the kinesin motor family, in the regulation of podosomes in primary human macrophages. We find that small interfering RNA (siRNA)/short-hairpin RNA-induced knockdown of KIF9 significantly affects both numbers and matrix degradation of podosomes. Overexpression and microinjection experiments reveal that the unique C-terminal region of KIF9 is crucial for these effects, presumably through binding of specific interactors. Indeed, we further identify reggie-1/flotillin-2, a signaling mediator between intracellular vesicles and the cell periphery, as an interactor of the KIF9 C-terminus. Reggie-1 dynamically colocalizes with KIF9 in living cells, and, consistent with KIF9-mediated effects, siRNA-induced knockdown of reggies/flotillins significantly impairs matrix degradation by podosomes. In sum, we identify the kinesin KIF9 and reggie/flotillin proteins as novel regulators of macrophage podosomes and show that their interaction is critical for the matrix-degrading ability of these structures.


Figures

FIGURE 1:
FIGURE 1:
KIF9 influences podosome numbers. (A) Evaluation of podosome formation in macrophages transfected with EGFP-C1, luciferase-specific siRNA, and KIF9-specific siRNA. Influence of siRNA was analyzed 24 h (left) and 48 h (right) after transfection. For each value, 3 × 30 cells were evaluated. Cells containing less than 10 podosomes at a given time point were scored as “containing no podosomes.” Values are given as mean percentage ± SD of total counts in Table 1. For differences between control values and values gained with KIF9 siRNA, a P value < 0.05 was considered significant (indicated by asterisk). (B, C) Fluorescence micrographs of primary human macrophages expressing scrambled shRNA (B) or KIF9-specific shRNA (C) 72 h after transfection. F-actin stained with rhodamine-labeled phalloidin. Inserts show respective GFP signals. White bar indicates 10 μm. (D, E) Evaluation of podosome formation in primary human macrophages transfected with psiSTRIKE vector bicistronically end encoding EGFP and scrambled shRNA, (D) or KIF9-specific shRNA (E). Influence of each shRNA was evaluated 24, 48, and 72 h after transfection. For each value, 3 × 30 cells were evaluated. Values are given as mean percentage ± SD of total counts in Table 1. For differences between control values and values gained with kinesin shRNAs, a P value < 0.05 was considered significant (indicated by asterisk).
FIGURE 2:
FIGURE 2:
Knockdown of KIF9 influences matrix degradation. Confocal laser scanning micrographs of primary human macrophages transfected with siRNA-luciferase (A) or siRNA-KIF9 (B), seeded on rhodamine-labeled gelatin matrix (red). Matrix degradation is visible as dark areas; insets show relevant F-actin staining by Cy5-labeled phalloidin (white). White bar, 10 μm. (C) Evaluation of matrix degradation in cells treated with siRNAs. The degree of matrix degradation was analyzed by fluorescence measurements of 3 × 30 cells each time. Complete absence of labeled matrix beneath cells was set as 100% degradation. Cells were scored into groups according to matrix degradation (0–40% and 41–100%). For differences between control values and values gained with KIF9 siRNA, a P value < 0.01 was considered highly significant (indicated by asterisks).
FIGURE 3:
FIGURE 3:
KIF9-GFP contacts microtubules and podosomes. (A) Confocal laser scanning micrographs of primary human macrophage expressing KIF9-GFP (green), labeled for α-tubulin (red). White boxes in overview image are enlarged on the right. White bar, 10 μm. (B) Image from confocal time-lapse video of a primary human macrophage expressing KIF9-GFP (green) and α-tubulin-mCherry, labeling microtubules (see Supplemental Video 1). White frame indicates detail images on the right (left panel: overlay; middle panel: α-tubulin-mCherry signal, right panel: KIF9-GFP signal). White bar, 5 μm. Elapsed time since start of the experiment is given in seconds on the right. (C) Image from confocal time-lapse video of a primary human macrophage expressing KIF9-GFP (green) and mRFP-β-actin (red), labeling podosomes (see Supplemental Video 2). Cell circumference is depicted by the dashed white line. (C) White frame indicates area of detail images on the right, elapsed time since start of the experiment is given in seconds in lower left corners. Note dynamic contact (white arrows) of KIF9-GFP particles with podosomes in the central area but not in the cell periphery.
FIGURE 4:
FIGURE 4:
KIF9-GFP is expressed in primary human macrophages and exists as a dimer. (A) KIF9 is expressed in primary human macrophages. Reverse transcriptase-PCR using KIF9-specific primers. A band of the expected size (435 base pairs) is detected. Agarose gel stained with ethidium bromide; size in base pairs on left. (B) Western blot developed with polyclonal rabbit antibody against C-terminal tail of KIF9. GST-KIF9-CT81 fusion construct before (lane 1) and after proteolytic cleavage (lane 2). Note reactivity of anti-KIF9 antibody with the fusion construct (indicated by chevron) and the cleaved CT81 peptide (10 kDa; arrowhead), but not with the GST tag (26 kDa). (C) GFP immunoprecipitation of macrophage lysates expressing GFP (left lane) or GFP-fused KIF9 (right lane); Western blot probed with anti-GFP antibody (left blot) or anti–KIF9-CT81 (right blot). Note coprecipitated bands that react with the anti-KIF9 antibody (indicated by arrows). Molecular mass in kilodaltons is indicated on the left.
FIGURE 5:
FIGURE 5:
KIF9 expression constructs and their localization in cells. (A) Domain organization of KIF9 and expression constructs used in this study: P-loop sequence (aa 93–100), motor domain signature (aa 1–300), stalk (aa 301–709), and unique tail (aa 710–790). Numbers indicate first and last amino acid residues of constructs. (B–J) Confocal laser scanning micrographs of primary human macrophages expressing different GFP-fused KIF9 constructs. (B, C) Primary human macrophage expressing GFP-fused KIF9 (C), stained for F-actin (B), with overlay shown in (D). (E, F) Primary human macrophage expressing GFP-fused KIF9-CT402 (F), stained for F-actin (E), with overlay shown in (G). (H, I). Primary human macrophage expressing GFP-fused KIF9-NT709 (H), stained for F-actin (I), with overlay shown in (J). (K, L) Primary human macrophage expressing GFP-fused KIF9-CT81 (K), stained for F-actin (L), with overlay shown in (M). White bar, 10 μm.
FIGURE 6:
FIGURE 6:
Microinjection of the KIF9 C-terminal region inhibits podosome reformation. (A) Evaluation of podosome numbers in macrophages microinjected with GST-KIF9-CT81 (0 h) and podosome reformation (1 h). For each bar, 3 × 30 cells were evaluated. Cells containing less than 10 podosomes at a given time point were scored as “containing no podosomes.” Values for podosome formation are given as mean percentage ± SD of total counts in Table 1. (B) Primary human macrophage 1 h after injection of 2 µg/µl GST-KIF9-CT81, labeled for F-actin (red), confocal laser scanning micrograph of substrate-attached part of cell. Injected cells were identified by labeling coinjected rat IgG (5 mg/ml) with FITC-labeled goat anti–rat IgG antibody (green). Note absence of podosomes in cell injected with GST-KIF9-CT81. White bar, 10 μm.
FIGURE 7:
FIGURE 7:
Golgi integrity is influenced by GFP-KIF9-CT81. (A–F) Confocal laser scanning micrographs of primary human macrophages expressing GPF-fused KIF9-CT81 (green, A and D), stained with specific primary antibody for TGN 46 (red, B and E) 7 h after transfection, with overlay shown in (C and F). Note compact Golgi appearance in untransfected cells, as opposed to dispersed Golgi morphology in cells expressing GFP-KIF9-CT81. White boxes in (D–F) indicate areas shown in enlarged insets. Cell circumferences are depicted by dashed white lines. White bars, 10 μm. (G) Evaluation of Golgi integrity 7 h after transfection of GFP-KIF9-CT81 or GFP as control. For each value, 3 × 30 cells were evaluated. Values are given as mean percentage ± SD of total counts in Table 1.
FIGURE 8:
FIGURE 8:
KIF9 interacts with reggie-1/flotillin-2. (A) Lysates of primary human macrophages immunoprecipitated with anti-GFP antibody coupled to magnetic beads. Silver-stained PAA gel, left lane: cells transfected with pEGFP-N1 as control; right lane: cells transfected with GFP-KIF9-CT81 construct. Arrow indicates band subsequently identified by mass spectrometry as reggie-1/2. Arrowheads indicate bands corresponding to GFP (left lane) and GFP-KIF9-CT81 (right lane), as judged by their mobility on PAA gels. Molecular mass in kilodaltons is indicated on the left. (For a comparison of immunoprecipitations performed with GFP-KIF9-CT81 and fl KIF9-GFP, see Supplemental Figure 7.) (B) GFP immunoprecipitation of KIF9-GFP–transfected macrophages, using GFP-N1 as control. Western blot developed with anti–reggie-1 antibody (left side) or with anti-GFP antibody (right side). (C) GFP immunoprecipitation of reggie-1-GFP–transfected macrophages, using GFP-N1 as control. Western blot developed with anti-KIF9 antibody (left side) or with anti-GFP antibody (right side). (D) GFP immunoprecipitation of KIF9-NT709-GFP–transfected macrophages, using GFP-N1 as control. Western blot developed with anti–reggie-1 antibody (left side) or with anti-GFP antibody (right side). Dashed lines indicate that lanes were not directly adjacent on original blots.
FIGURE 9:
FIGURE 9:
KIF9 and reggie-1 colocalize in fixed and living cells. (A–F) Confocal laser scanning micrographs of primary human macrophages expressing GFP-KIF9-CT81 (green, A), stained for reggie-1 (red, B) with specific primary antibody, with overlay shown in (C). Cell circumference is depicted by the dashed white line. White boxes indicate areas shown in detail images. (D–F) Confocal laser scanning micrographs of primary human macrophages coexpressing KIF9-mCherry (red, D) and reggie-1-GFP (green, E) with overlay shown in (F). (G, H) Images from confocal time-lapse videos of primary human macrophages expressing reggie-1-GFP (green) and KIF9-mCherry (red). White frames indicate areas of detail images. White bar, 10 μm. (G′, H′, H″) Time-lapse sequences from Supplemental Videos 6–8, taken from respective detail regions indicated in (G, H). Note close and repeated nonrandom contact between reggie-1-GFP (arrowheads) and KIF9-mCherry vesicles (arrows). Time since start of the experiments is indicated in seconds in upper right corners.
FIGURE 10:
FIGURE 10:
Knockdown of reggie proteins influences matrix degradation. Confocal laser scanning micrographs of primary human macrophages transfected with siRNA-luciferase (A), siRNA-reggie-1 (B), siRNA-reggie-2 (C), or a combination of both reggie siRNAs (D), seeded on rhodamine-labeled gelatin matrix (red). Matrix degradation is visible as dark areas; insets show relevant F-actin staining by Cy5-labeled phalloidin (white). White bar, 10 μm. (E) Evaluation of matrix degradation in cells treated with siRNAs. The degree of matrix degradation was analyzed by fluorescence measurements of 3 × 30 cells each time. Complete absence of labeled matrix beneath cells was set as 100% degradation. Cells were scored into groups according to matrix degradation (0–40% and 41–100%). For differences between control values and values gained with reggie siRNAs, a P value < 0.05 was considered significant, and a P value < 0.01 was considered highly significant (indicated by asterisks). Values are given as mean percentage ± SD of total counts in Table 1.

Similar articles

Cited by

References

    1. Babuke T, Tikkanen R. Dissecting the molecular function of reggie/flotillin proteins. Eur J Cell Biol. 2007;86:525–532. - PubMed
    1. Buccione R, Caldieri G, Ayala I. Invadopodia: specialized tumor cell structures for the focal degradation of the extracellular matrix. Cancer Metastasis Rev. 2009;28:137–149. - PubMed
    1. Caldieri G, Buccione R. Aiming for invadopodia: organizing polarized delivery at sites of invasion. Trends Cell Biol. 2010;20:64–70. - PubMed
    1. Chabadel A, Banon-Rodriguez I, Cluet D, Rudkin BB, Wehrle-Haller B, Genot E, Jurdic P, Anton IM, Saltel F. CD44 and beta3 integrin organize two functionally distinct actin-based domains in osteoclasts. Mol Biol Cell. 2007;18:4899–4910. - PMC - PubMed
    1. Chen Proteases associated with invadopodia, and their role in degradation of extracellular matrix. Enzyme Protein. 1996;49:59–71. - PubMed

Publication types

MeSH terms