. 2010 Nov 30:6:437.
doi: 10.1038/msb.2010.90.

Single-cell quantification of IL-2 response by effector and regulatory T cells reveals critical plasticity in immune response

Affiliations

Single-cell quantification of IL-2 response by effector and regulatory T cells reveals critical plasticity in immune response

Ofer Feinerman et al. Mol Syst Biol. .

Abstract

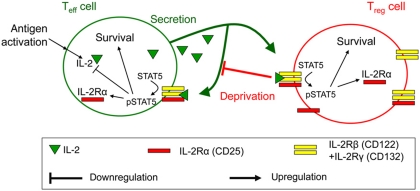
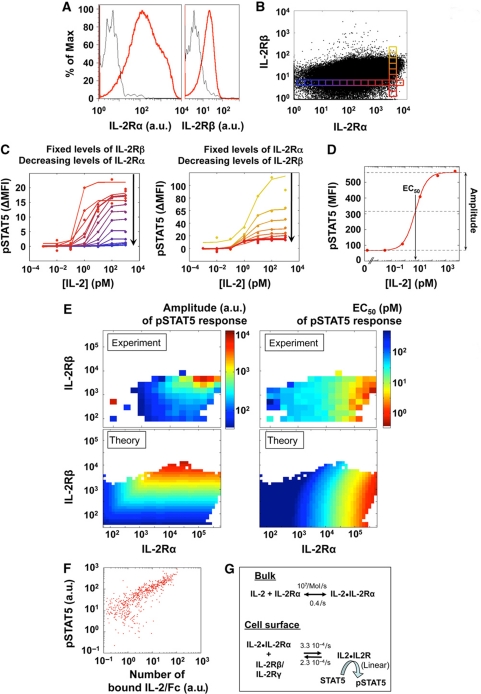
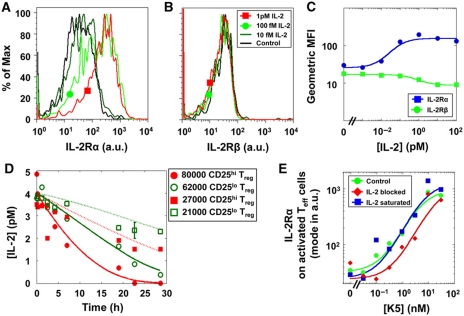
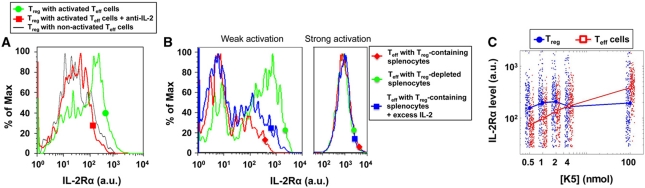
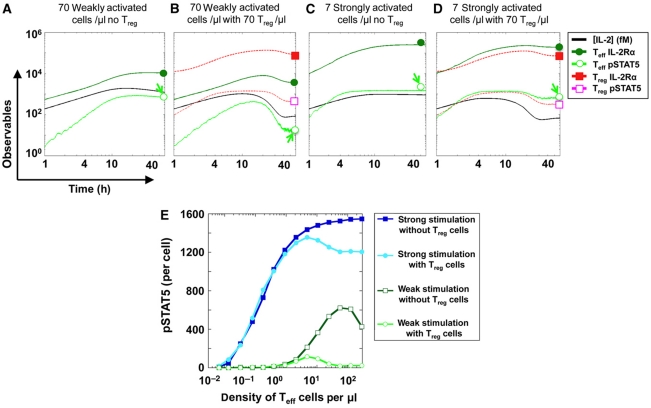
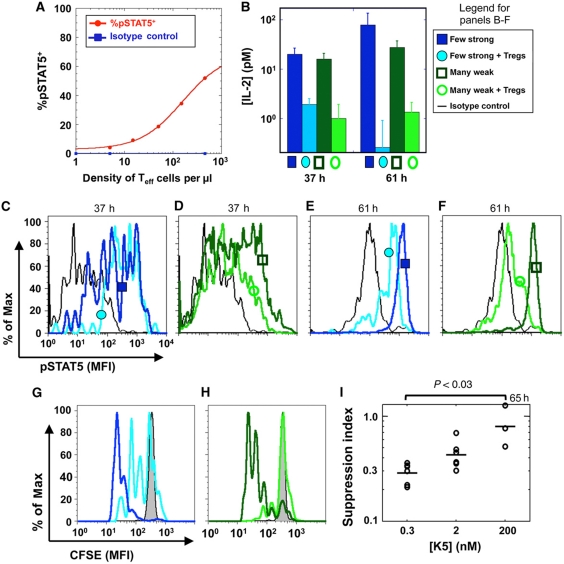
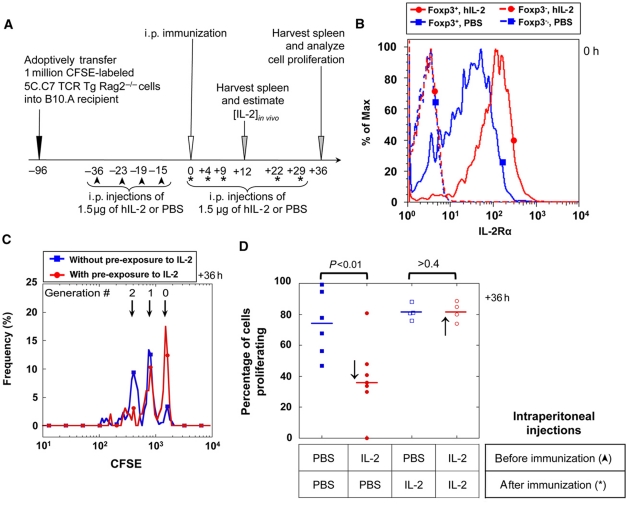
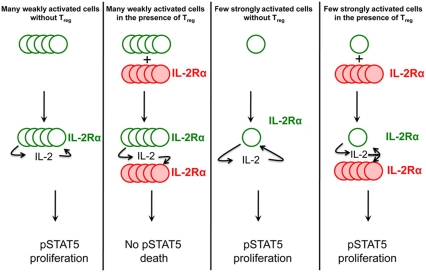
Understanding how the immune system decides between tolerance and activation by antigens requires addressing cytokine regulation as a highly dynamic process. We quantified the dynamics of interleukin-2 (IL-2) signaling in a population of T cells during an immune response by combining in silico modeling and single-cell measurements in vitro. We demonstrate that IL-2 receptor expression levels vary widely among T cells creating a large variability in the ability of the individual cells to consume, produce and participate in IL-2 signaling within the population. Our model reveals that at the population level, these heterogeneous cells are engaged in a tug-of-war for IL-2 between regulatory (T(reg)) and effector (T(eff)) T cells, whereby access to IL-2 can either increase the survival of T(eff) cells or the suppressive capacity of T(reg) cells. This tug-of-war is the mechanism enforcing, at the systems level, a core function of T(reg) cells, namely the specific suppression of survival signals for weakly activated T(eff) cells but not for strongly activated cells. Our integrated model yields quantitative, experimentally validated predictions for the manipulation of T(reg) suppression.


Conflict of interest statement

The authors declare that they have no conflict of interest.

Figures

Figure 1
Figure 1
Qualitative model for the regulation of T-cell proliferation by IL-2. Upon antigenic activation, Teff cells secrete IL-2 and upregulate IL-2Rα. The trimeric IL-2R binds IL-2 to induce phosphorylation of STAT5, promote cell survival, and further upregulate IL-2Rα production while downregulating IL-2 expression. Bound IL-2 is endocytosed and degraded. Treg cells never express IL-2 but respond to it similarly as they express IL-2Rα even when lacking antigenic stimulation. IL-2 depletion by Treg cells constitutes a negative feedback on Teff survival. For details see Supplementary information 1.
Figure 2
Figure 2
Responsiveness to IL-2 depends on the levels of IL-2Rα and IL-2Rβ on individual cells. (A, B) T-cell blasts, 65 h after antigen stimulation, present highly varied levels of IL-2Rα and IL-2Rβ on their surface. The small boxes in (B) represent individual bins within the distribution of IL-2Rα and IL-2Rβ, for each we analyze the pSTAT5 response. (C). This heterogeneous population of T-cell blasts was exposed to varied concentrations of IL-2 for 10 min, fixed, permeabilized, and stained for pSTAT5. Measurements were normalized bin by bin by substracting the baseline pSTAT5 level as measured in the corresponding bin of the ‘no IL-2’ condition. Dose responses are presented for varying levels of IL-2Rα (left panel) or varying levels of IL-2Rβ (right panel), as defined by color code in panel (B). (D) A typical sigmoidal fit for STAT5 phosphorylation that yields Amplitude and EC50 for the IL-2 response. (E) Dose responses for pSTAT5 were analyzed for different expression levels of IL-2 receptor subunits (IL-2Rα and IL-2Rβ) in individual cells by FACS (experiment) or modeled (theory, as described in F). Amplitudes are presented in the left panels (arbitrary units for experiment or number of pSTAT5 for the theory) and EC50 (pM) in the right panels. (F) Costaining for phospho-STAT5 and IL-2-Fc in individual cells reveals a near linear relationship between IL-2 binding and STAT5 phosphorylation. (G). A biochemical model relates known thermodynamic quantities to whole-cell pSTAT5 responses to IL-2. In our model, IL-2Rβ and IL-2Rγ bind to the weakly engaged IL-2Rα all at once: we simulated these chains as a single complex IL-2Rβ/IL-2Rγ (Lenardo, 1991).
Figure 3
Figure 3
Dynamics of IL-2Rα upregulation and IL-2 depletion for Treg and Teff cells. IL-2Rα (A) and IL-2Rβ (B) levels on isolated Treg cells incubated in the presence of 10 fM to 1 pM IL-2 for 40 h. Results are summarized in (C), revealing that Treg cells upregulate IL-2Rα by six-fold with an EC50 of 60 fM of IL-2. Similar results were obtained for non-isolated Treg cells. (D) Depletion of IL-2 in vitro in four different conditions of Treg number and IL-2Rα levels. IL-2Rα levels on Treg cells that were pre-exposed to IL-2 (CD25hi) are initially centered around 2.7 × 10⁴ molecules/cell, which is 2.7 times higher than the levels of this receptor on cells derived from PBS-treated mice (CD25lo). The four depletion curves were fitted at once by adjusting a single parameter (P<0.05). (E) IL-2Rα expression levels among activated Teff cells increase with peptide stimulation (38 h). Saturating levels of IL-2 does not restore full IL-2Rα upregulation for cells stimulated with low-antigen concentrations. Blocking IL-2 decreases IL-2Rα levels for intermediate peptide stimulation. Error bars for Figure 3C and E are smaller than the graph symbols.
Figure 4
Figure 4
Variable IL-2Rα upregulation in cocultures of Treg and Teff cells after 24 h of antigen activation. (A) Non-TCR-activated Treg cells upregulate IL-2Rα when cocultured with antigen-activated Teff cells. Reversal of this effect by IL-2 blocking antibodies shows that this IL-2Rα upregulation is specifically triggered by the IL-2 secreted by neighboring Teff cells. (B) The presence of Treg cells decreases IL-2Rα levels for weakly (1 nM, left panel) but not strongly (1 μM, right panel) stimulated Teff cells. This effect is only partially reversible by addition of exogenous IL-2. (C) IL-2Rα levels (of 200 representative cells) and their geometrical mean on peptide-stimulated Teff and non-TCR-activated Treg cells cocultured with different antigen doses. For the effector cells, the geometrical mean is taken over the IL-2Rα+ population only.
Figure 5
Figure 5
Computer simulations of the IL-2 tug-of-war between Teff and Treg cells. (AD) We modeled in silico the first 60 h of activation of a culture of Teff cells (7 strongly activated or 70 weakly activated cells per μl) in the presence or absence of 70 Treg cells per μl. We plot the simulated numbers of IL-2Rα and pSTAT5/cell, and the simulated IL-2 concentration (in fMol) in the medium. We present two extreme cases illustrating how Treg cells can suppress pSTAT5 in weakly activated cells at a high density (arrow, panel B), while marginally affecting pSTAT5 for strongly activated cells in a smaller density (arrow, panel D). We chose these conditions such that, in the absence of Treg cells, the IL-2 levels secreted in both cases were matched (panels A and C); the major difference between these two cases is then the maximal IL-2Rα levels that the cells present on their surface upon activation. Note that simulating the system with a heterogeneous population of T cells was found not to affect modeling predictions for our experimental setting (our unpublished data). Hence, in our present model, all Teff cells share the same activation strength, and all Treg cells share the same level of IL-2Rα. (E) Computer prediction of a differential effect of Treg cells on the quorum-sensing threshold for STAT5 phosphorylation of strongly activated versus weakly activated Teff cells. We compute the total pSTAT5 (in molecules/cell) generated after 60 h in individual Teff cells, simulated at varied density with or without an equal density of Treg cells.
Figure 6
Figure 6
Treg cells inflict an IL-2Rα /IL-2 double hit to differentially suppress a large number of weakly activated but not a small number of strongly activated effector cells in vitro. (A) pSTAT5 response for 5C.C7 T cells at 46 h of stimulation with 0.3 μM K5 (the red line is a simple dose-response fit and a guide to the eyes). Although all cells were stimulated by the same antigen dose, only those at high densities sense IL-2 and phosphorylate STAT5. At low densities, cells do not sense IL-2 at all, ruling out the possibility of an autocrine loop. (B) IL-2 concentrations are similar for many weakly or a few strongly activated cells (60 000 cells with 2 nM of K5 peptide versus 3000 cells with 100 nM K5). When we added 60 000 Treg cells (yielding a ratio of Teff:Treg cells of 1:1 or 1:20), we found a similar scavenging effect for IL-2. (CF) Comparing pSTAT5 levels in effector cells in the presence or absence of Treg cells at 37 h (C–D) or at 61 h (E–F) reveals a marked specific suppression of weakly activated effector cells only (D, F). (G, H) Suppression of proliferation, as measured by CFSE dilution at 61 h, is more pronounced for many weakly activated effector cells (H) than for a few strongly activated cells (G). (I) Treg cells suppress the proliferation of Teff cells better for cells undergoing weak antigen activation ([K5]=0.3 nmol) compared to cells undergoing strong antigen activation ([K5]=200 nmol). The suppression index is defined as the ratio of the numbers of Teff cells undergoing proliferation in the presence of Treg cells with the numbers of Teff cells undergoing proliferation in the absence of Treg cells after peptide stimulation. These data were pooled from four separate experiments.
Figure 7
Figure 7
Early administration of IL-2 has a suppressive effect on Teff cell proliferation upon peptide immunization in vivo. (A) Experimental protocol (asterisks indicate additional i.p. injection of 1.5 μg of rhIL-2 for the control experiment presented in Figure 7D). (B) CD4+Foxp3+ Treg cells, but not CD4+Foxp3 Teff cells, respond to four in vivo injections of 1.5 μg rhIL-2, over 36 h before immunization, by upregulating IL-2Rα levels (PBS is used as a negative control). (C) CFSE dilution in Teff cells 36 h after immunization. (D) IL-2-treated and PBS-treated (control) mice before immunization reveal a significant negative effect of early IL-2 administration on the percentages of cells that start dividing following immunization (↓). However, IL-2 treatment post-immunization compensates for this defective proliferation (marked with * in Figure 7A and with ↑ in this panel).
Figure 8
Figure 8
Sketch of the differential suppression by Treg cells, based on the ‘double hit’ cytokine depletion mechanism. Empty green circles denote Teff cells and full red circles denote Treg cells. Increased font size for IL-2Rα and IL-2 is used to signify increased levels for these receptor and cytokine. This sketch summarizes how Treg cells can suppress pSTAT5 and proliferation signals in large numbers of weakly activated Teff cells, while allowing a small number of strongly activated Teff cells to maintain pSTAT5 and proliferate.

References

    1. Altan-Bonnet G, Germain RN (2005) Modeling T cell antigen discrimination based on feedback control of digital ERK responses. PLoS Biol 3: e356. - PMC - PubMed
    1. Barthlott T, Moncrieffe H, Veldhoen M, Atkins CJ, Christensen J, O’Garra A, Stockinger B (2005) CD25+ CD4+ T cells compete with naive CD4+ T cells for IL-2 and exploit it for the induction of IL-10 production. Int Immunol 17: 279–288 - PubMed
    1. Belkaid Y, Piccirillo CA, Mendez S, Shevach EM, Sacks DL (2002) CD4+CD25+ regulatory T cells control Leishmania major persistence and immunity. Nature 420: 502–507 - PubMed
    1. Blinov ML, Faeder JR, Goldstein B, Hlavacek WS (2004) BioNetGen: software for rule-based modeling of signal transduction based on the interactions of molecular domains. Bioinformatics 20: 3289–3291 - PubMed
    1. Brand OJ, Lowe CE, Heward JM, Franklyn JA, Cooper JD, Todd JA, Gough SC (2007) Association of the interleukin-2 receptor alpha (IL-2Ralpha)/CD25 gene region with Graves’ disease using a multilocus test and tag SNPs. Clin Endocrinol (Oxf) 66: 508–512 - PubMed

Publication types

MeSH terms

Substances