. 2010 Nov 5:4:127.
doi: 10.3389/fnint.2010.00127. eCollection 2010.

"Stay tuned": inter-individual neural synchronization during mutual gaze and joint attention

Affiliations

"Stay tuned": inter-individual neural synchronization during mutual gaze and joint attention

Daisuke N Saito et al. Front Integr Neurosci. .

Abstract

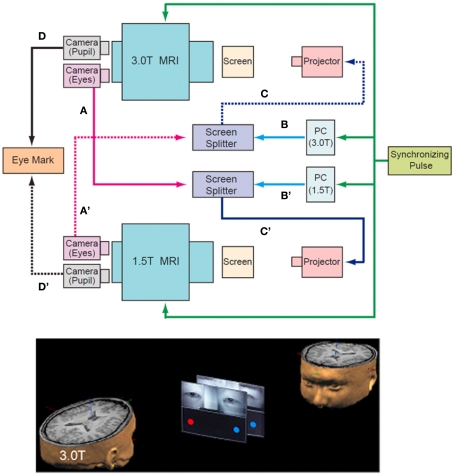
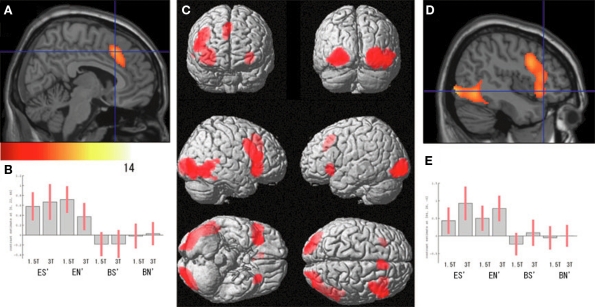
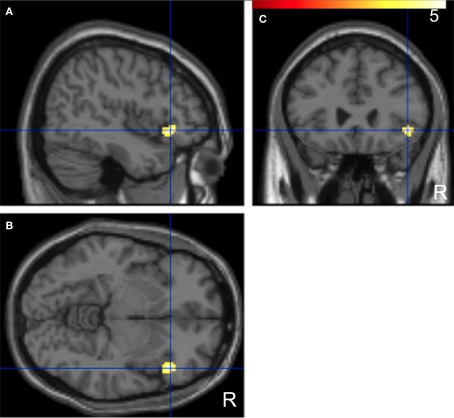
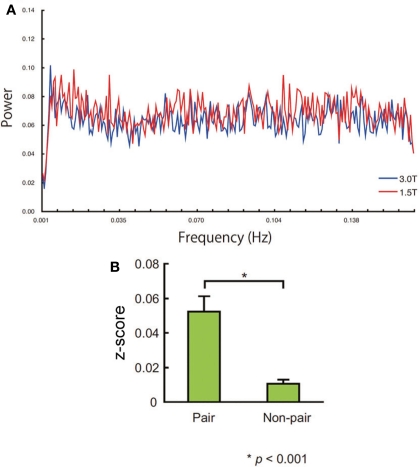
Eye contact provides a communicative link between humans, prompting joint attention. As spontaneous brain activity might have an important role in the coordination of neuronal processing within the brain, their inter-subject synchronization might occur during eye contact. To test this, we conducted simultaneous functional MRI in pairs of adults. Eye contact was maintained at baseline while the subjects engaged in real-time gaze exchange in a joint attention task. Averted gaze activated the bilateral occipital pole extending to the right posterior superior temporal sulcus, the dorso-medial prefrontal cortex, and the bilateral inferior frontal gyrus. Following a partner's gaze toward an object activated the left intraparietal sulcus. After all the task-related effects were modeled out, inter-individual correlation analysis of residual time-courses was performed. Paired subjects showed more prominent correlations than non-paired subjects in the right inferior frontal gyrus, suggesting that this region is involved in sharing intention during eye contact that provides the context for joint attention.

Keywords: eye contact; functional MRI; hyper-scan; joint attention.


Figures

Figure 1
Figure 1
Schematic diagram of the “hyper-scan. ” Near-infrared eye-tracking systems implemented onto two MRI scanners (1.5T and 3.0T) captured video images of each participant's eyes and eyebrows, which were transferred to the screen splitter (A and A′) that bound them to the computer-generated visual stimuli (B and B′). The combined images were projected onto the screen in front of the counterpart through the projector (C and C′). The data for pupils were used to calculate the position of the gaze (D and D’). The other participant's eyes were presented on the upper half of the screen, and the computer-generated images of balls were displayed at both ends of the screen in the lower half (bottom). The timing of the MRI scanning and the stimulus presentation were synchronized by the pulse signal from the controller of the eye-tracking system to the two MRI scanners and the PC for the presentation of visual stimuli (top, green line).
Figure 2
Figure 2
Joint attention task. The virtual relationship between two participants (P and Q) in the scanner. Arrows indicate the gaze direction toward the screen. Blue and red rectangles indicate the ball cue. During concordant runs (left columns), participants were required to shift their gaze to the target cued by either ball (by means of color) or eye gaze. Each task trial lasted 5 s. During discordant runs (right columns), participants are asked to shift their gaze to the opposite side of the target. BN, ball-non-share; BS, ball-share; EN, eye-non-share; ES, eye-share; SBNc, simultaneous ball-non-share during concordant run; SBNd, simultaneous ball-non-share during discordant run.
Figure 3
Figure 3
RT of each condition averaged across subjects (n = 38). Error bars indicate the standard error of the mean.
Figure 4
Figure 4
Effect of eye cueing. (A) The effect of eyes (ES′ + EN′) − (BS′ + BN′) is superimposed on the parasagittal images where the blue lines cross at (6, 22, 44) in the prMFC. The color scale indicates the t-values. (B) The task-related activation of each condition compared with their corresponding control condition at (6, 22, 44). ES′, ES − SBNc; EN′, EN − SBNd; BS′, BS − SBNc; BN′, BN − SBNd. Error bars indicate the 90% confidence interval. (C) The effect of eye cueing is superimposed on the 3D surface-rendered high-resolution MR image. (D) The effect of eye cueing in the right IFG (44, 26, −6) and (E) its task-related activation are shown in the same format as (A) and (B), respectively.
Figure 5
Figure 5
Cueing × sharing interaction. Activation by the contrast of (ES′ − EN′) − (BS′ − BN′) is superimposed on the parasagittal (A), axial (B), and coronal (C) sections of high-resolution MR images intersected at (−28, −68, 46), corresponding to the left IPS. The color scale indicates the t-values. (D) The task-related activation of each condition is compared with the control condition, with the same format as shown in Figure 4.
Figure 6
Figure 6
Significant positive correlations of the innovation between the paired subjects who had been “face-to-face” during fMRI compared with the non-paired subjects. Images are superimposed on the parasagittal (A), axial (B), and coronal (C) sections of T1-weighted high-resolution MR images. The blue lines in each section cross in the right IFG (44, 26, −6). The color scale indicates the t-values.
Figure 7
Figure 7
(A) Power spectrum of the averaged innovations obtained by ARx at (44, 26, −6). No sharp peak of the power spectrum was noted. (B) Standardized correlation value (z-score) of the pair and non-pair group. Error bars indicate the standard error of the mean.

References

    1. Allison T., Puce A., McCarthy G. (2000). Social perception from visual cues: role of the STS region. Trends Cogn. Sci. 4, 267–27810.1016/S1364-6613(00)01501-1 - DOI - PubMed
    1. Amodio D. M., Frith C. D. (2006). Meeting of minds: the medial frontal cortex and social cognition. Nat. Rev. Neurosci. 7, 268–27710.1038/nrn1884 - DOI - PubMed
    1. Ban T., Shiwa T., Kawamura K. (1991). Cortico-cortical projections from the prefrontal cortex to the superior temporal sulcal area (STs) in the monkey studied by means of HRP method. Arch. Ital. Biol. 129, 259–272 - PubMed
    1. Bandettini P. A. (2001). “Selection of the optimal pulse sequence for functional MRI,” in Functional MRI: An Introduction to Methods, eds Jezzard P., Matthews P. M., Smith S. M. (Oxford: Oxford University Press; ), 123–143
    1. Baron-Cohen S. (1995). Mindblindness: An Essay on Autism and Theory of Mind. Cambridge: MIT Press