Comparative Study
. 2011:181-92.
doi: 10.1142/9789814335058_0020.

Computational generation inhibitor-bound conformers of p38 MAP kinase and comparison with experiments

Affiliations
Comparative Study

Computational generation inhibitor-bound conformers of p38 MAP kinase and comparison with experiments

Ahmet Bakan et al. Pac Symp Biocomput. 2011.

Abstract

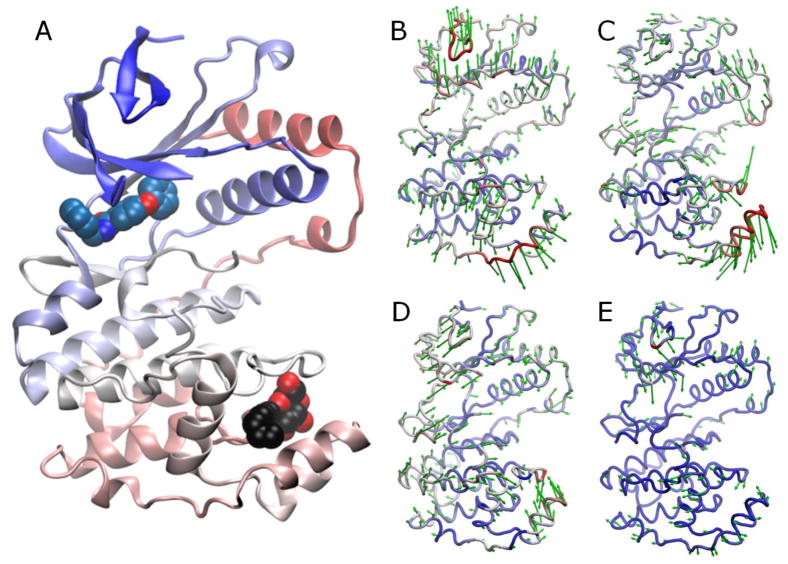
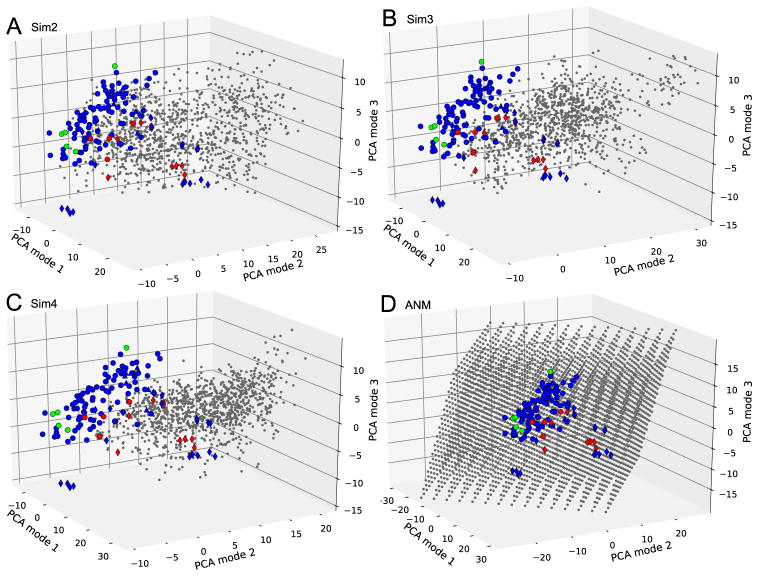
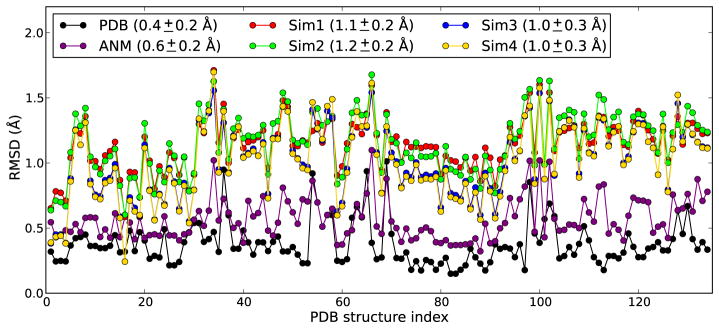
The p38 MAP kinases play a critical role in regulating stress-activated pathways, and serve as molecular targets for controlling inflammatory diseases. Computer-aided efforts for developing p38 inhibitors have been hampered by the necessity to include the enzyme conformational flexibility in ligand docking simulations. A useful strategy in such complicated cases is to perform ensemble-docking provided that a representative set of conformers is available for the target protein either from computations or experiments. We explore here the abilities of two computational approaches, molecular dynamics (MD) simulations and anisotropic network model (ANM) normal mode analysis, for generating potential ligand-bound conformers starting from the apo state of p38, and benchmark them against the space of conformers (or the reference modes of structural changes) inferred from principal component analysis of 134 experimentally resolved p38 kinase structures. ANM-generated conformations are found to provide a significantly better coverage of the inhibitor-bound conformational space observed experimentally, compared to MD simulations performed in explicit water, suggesting that ANM-based sampling of conformations can be advantageously employed as input structural models in docking simulations.


Figures

Fig. 1
Fig. 1. p38 structure and reference modes
A. p38 structure (PDB id: 1ZYJ) is shown as a ribbon diagram colored by residue index from blue to red. The upper and lower lobes are referred to as the N- and C-terminal lobes. Two ligand-binding sites are distinguished: ATP-binding site, with the bound inhibitor shown in blue spheres; and the site at the MAPK insert, marked by the bound lipid (n-octyl-β-D-glucoside) in black/red space filling representation. B–E. Directions of PCA modes 1-4 (green arrows) retrieved from the analysis of 134 X-ray crystallographically resolved p38 structures in different forms. Coloring is based on mobility along the mode directions, red being most mobile.
Fig. 2
Fig. 2. Distribution of the PDB ensemble of structures on the subspaces spanned by reference modes
134 p38 structures are projected onto PC1-PC2 (A) and PC3-PC4 (B) subspaces. Markers are described in Table 1. The distributions of structures along the individual modes are shown by the histograms.. A conformation on the positive portion of these projections corresponds to a deformation along the direction indicated by the arrows in Fig. 1B–E.
Fig. 3
Fig. 3. Projections of MD and ANM ensembles onto the subspace spanned by the reference modes PC1-PC3
Ensembles from Sim2, Sim3, Sim4, and ANM are shown in panels A, B, C, and D, respectively. PDB structures are marked as in Fig. 2. Conformations generated by computations are shown by gray points. The perspective is the same in all panels for ease of comparison.
Fig. 4
Fig. 4. Minimum RMSD from PDB structures
Results are shown for all PDB structures (indexed in alphabetical order along the abscissa). The black curve refers to the RMSDs from the PDB structures themselves (experimental data); the purple curve displays the min RMSDs achieved by ANM sampling; and other curves (labeled) refer to MD runs Mean and standard deviations are given in the legend.
Fig. 5
Fig. 5. Correlations between experimentally observed and computationally obtained modes of structural changes
Panels A–C show the overlap between top-ranking PCA modes (from 134 PDB structures) and the modes yielded by MD runs EDA. Panel D displays the overlaps between ANM and PCA modes.

References

    1. Kumar S, Boehm J, Lee JC. Nat Rev Drug Discov. 2003;2:717. - PubMed
    1. Cavasotto CN, Abagyan RA. J Mol Biol. 2004;337:209. - PubMed
    1. Bakan A, Bahar I. Proc Natl Acad Sci U S A. 2009;106:14349. - PMC - PubMed
    1. Totrov M, Abagyan R. Curr Opin Struct Biol. 2008;18:178. - PMC - PubMed
    1. Dror RO, Jensen MO, Borhani DW, Shaw DE. J Gen Physiol. 2010;135:555. - PMC - PubMed

Publication types

MeSH terms