

Real-time monitoring of sustained drug release using the optical properties of porous silicon photonic crystal particles
- PMID: 21122914
- PMCID: PMC3025697
- DOI: 10.1016/j.biomaterials.2010.11.013
Real-time monitoring of sustained drug release using the optical properties of porous silicon photonic crystal particles
Abstract
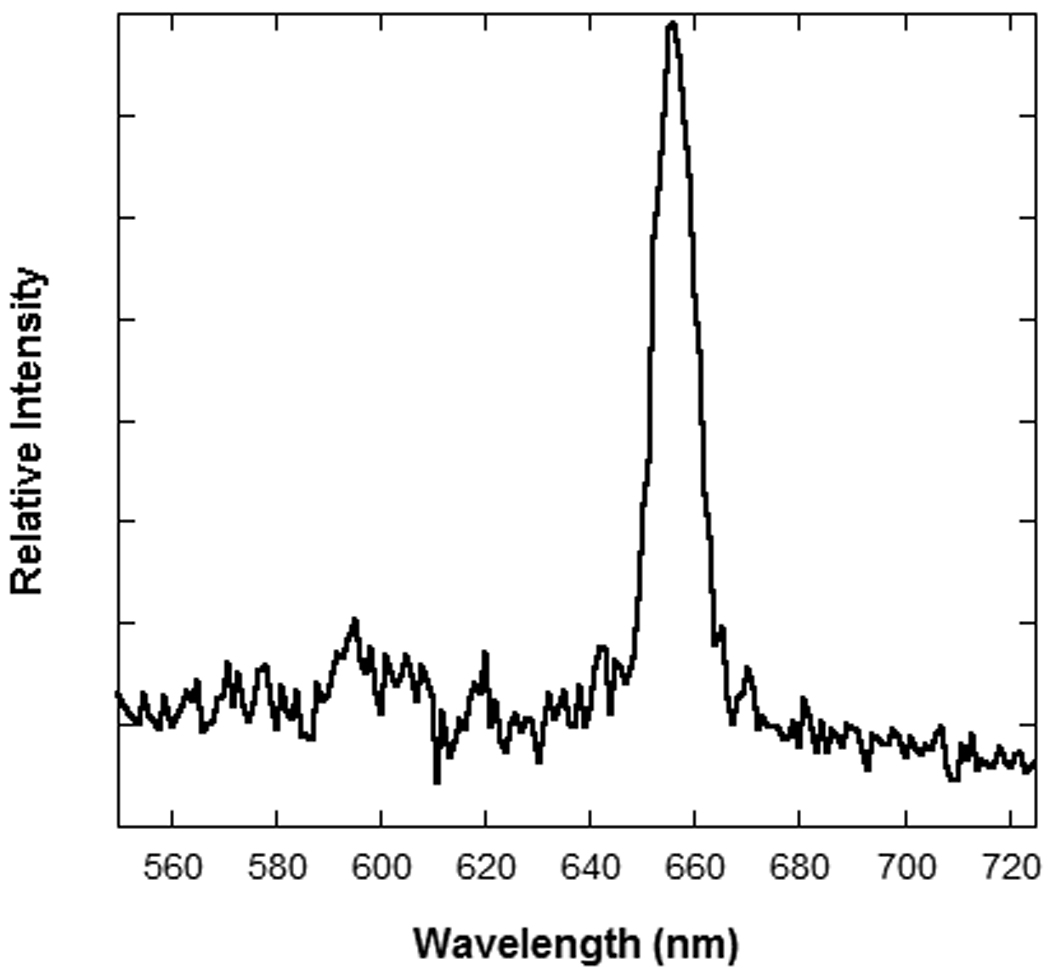
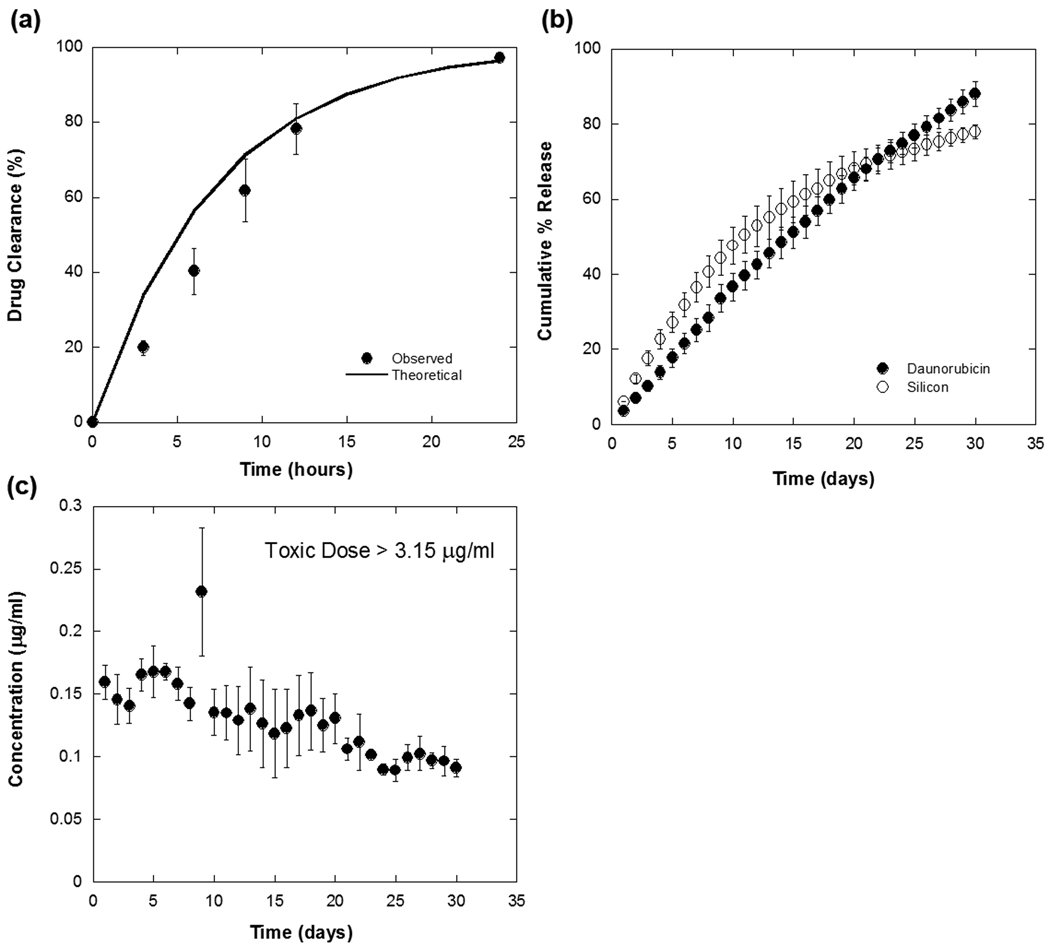
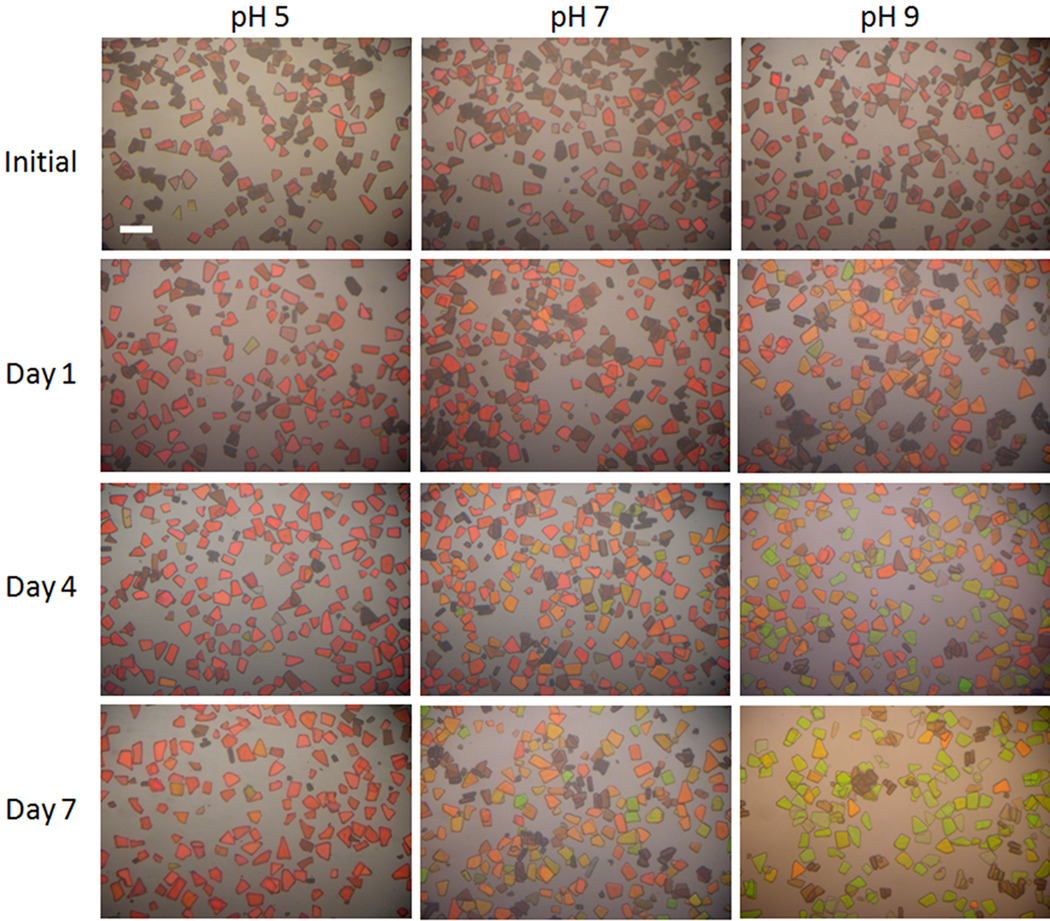
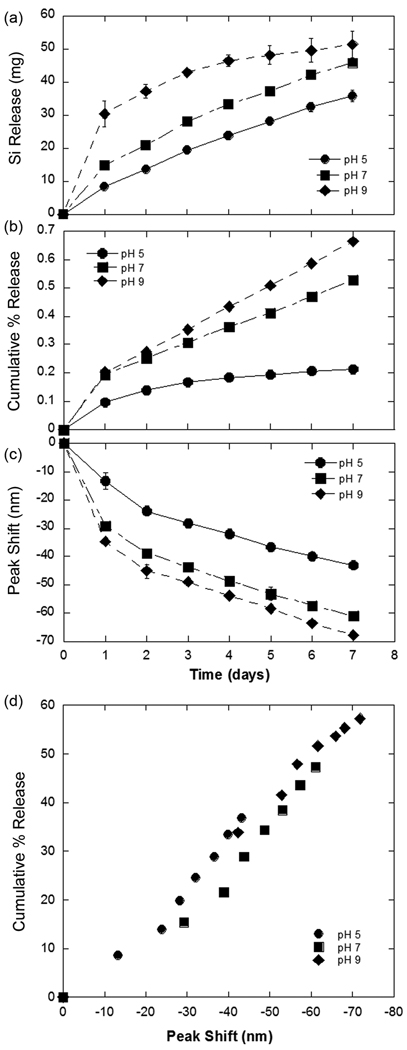
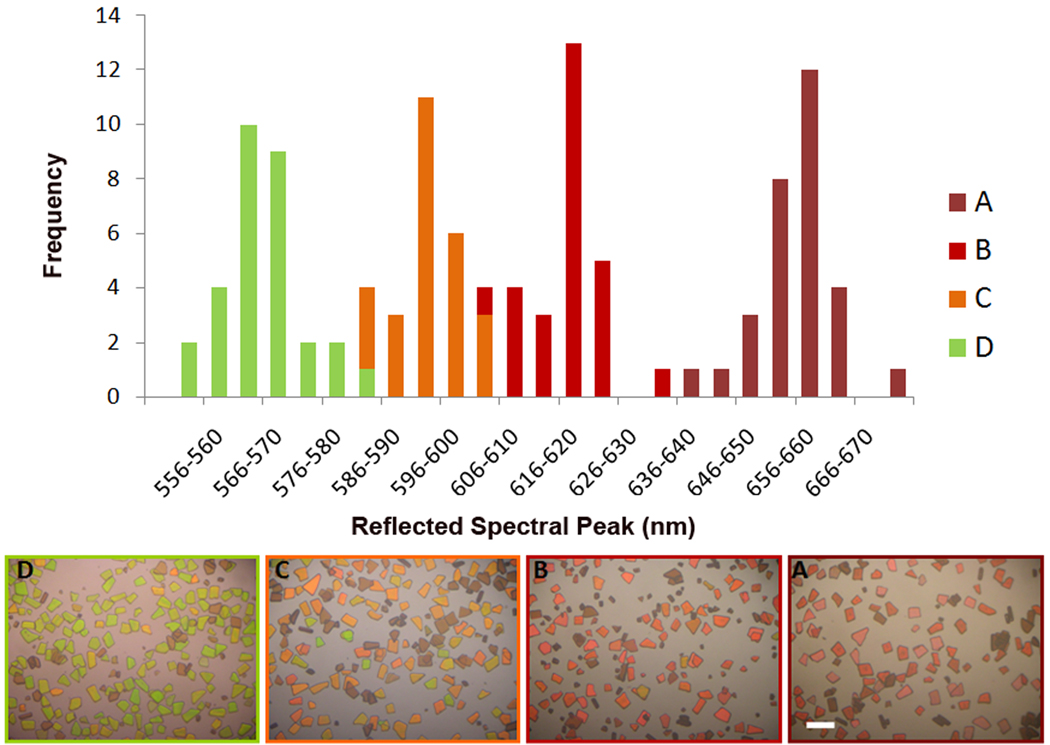
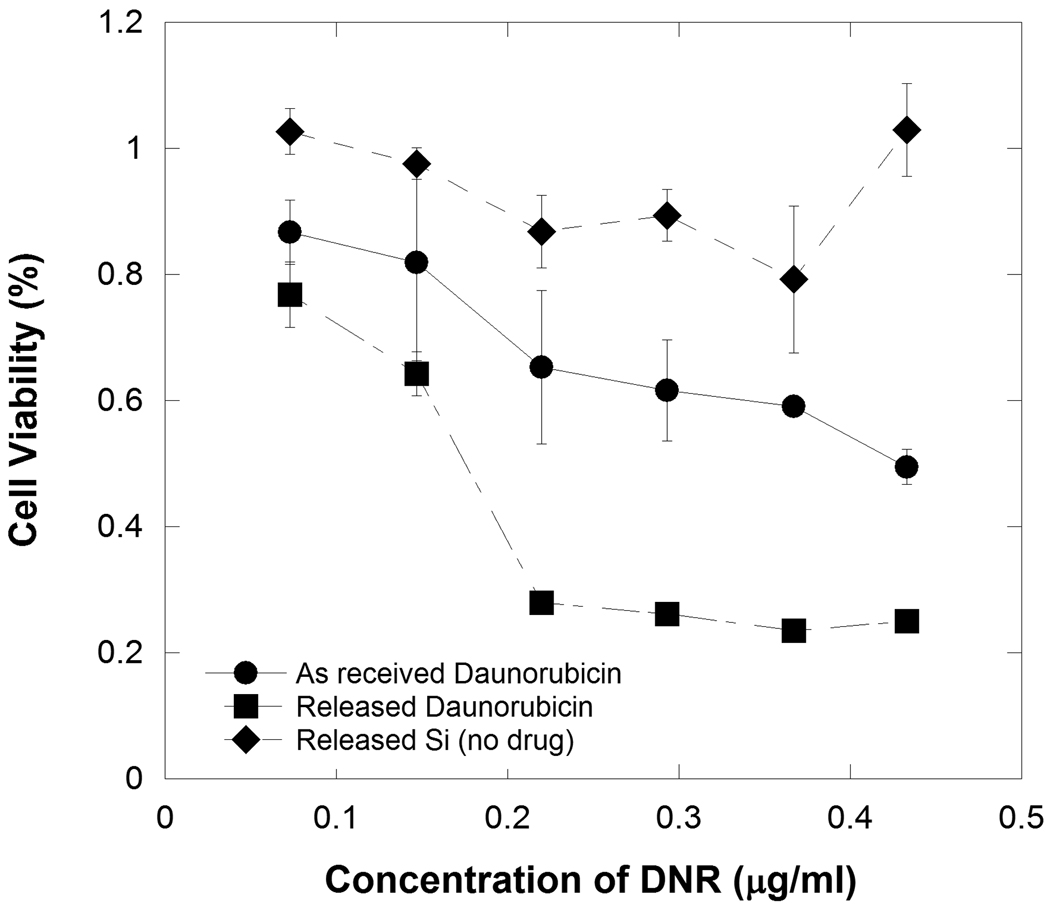
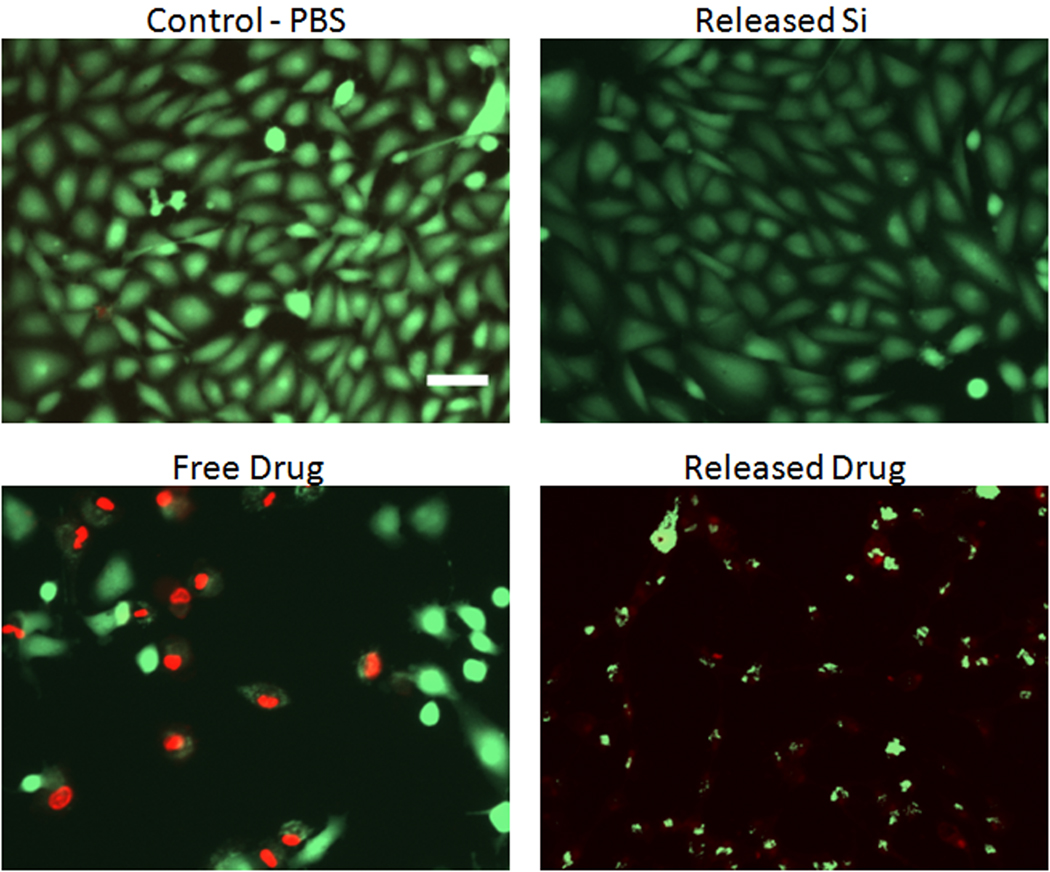
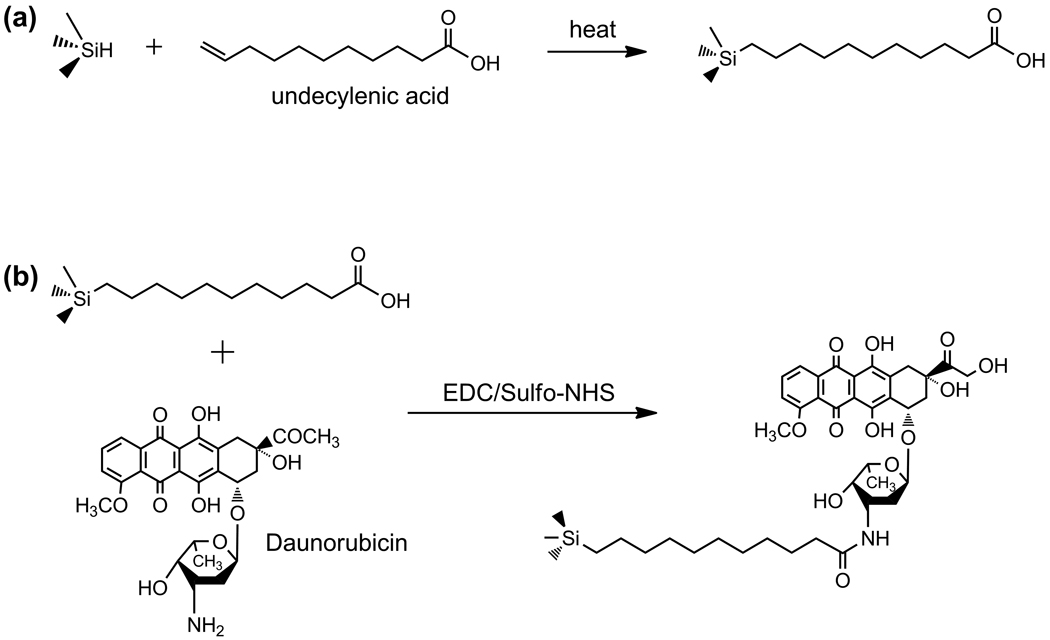
A controlled and observable drug delivery system that enables long-term local drug administration is reported. Biodegradable and biocompatible drug-loaded porous Si microparticles were prepared from silicon wafers, resulting in a porous 1-dimensional photonic crystal (rugate filter) approx. 12 μm thick and 35 μm across. An organic linker, 1-undecylenic acid, was attached to the Si-H terminated inner surface of the particles by hydrosilylation and the anthracycline drug daunorubicin was bound to the carboxy terminus of the linker. Degradation of the porous Si matrix in vitro was found to release the drug in a linear and sustained fashion for 30 d. The bioactivity of the released daunorubicin was verified on retinal pigment epithelial (RPE) cells. The degradation/drug delivery process was monitored in situ by digital imaging or spectroscopic measurement of the photonic resonance reflected from the nanostructured particles, and a simple linear correlation between observed wavelength and drug release was observed. Changes in the optical reflectance spectrum were sufficiently large to be visible as a distinctive red to green color change.
Copyright © 2010 Elsevier Ltd. All rights reserved.
Figures
Similar articles
-
Hydrosilylated porous silicon particles function as an intravitreal drug delivery system for daunorubicin.J Ocul Pharmacol Ther. 2013 Jun;29(5):493-500. doi: 10.1089/jop.2012.0205. Epub 2013 Feb 28. J Ocul Pharmacol Ther. 2013. PMID: 23448595 Free PMC article.
-
Monitoring of degradation of porous silicon photonic crystals using digital photography.Nanoscale Res Lett. 2014 Aug 21;9(1):410. doi: 10.1186/1556-276X-9-410. eCollection 2014. Nanoscale Res Lett. 2014. PMID: 25242902 Free PMC article.
-
Tunable sustained intravitreal drug delivery system for daunorubicin using oxidized porous silicon.J Control Release. 2014 Mar 28;178:46-54. doi: 10.1016/j.jconrel.2014.01.003. Epub 2014 Jan 11. J Control Release. 2014. PMID: 24424270 Free PMC article.
-
Porous silicon in drug delivery devices and materials.Adv Drug Deliv Rev. 2008 Aug 17;60(11):1266-1277. doi: 10.1016/j.addr.2008.03.017. Epub 2008 Apr 10. Adv Drug Deliv Rev. 2008. PMID: 18508154 Free PMC article. Review.
-
Nanostructured porous silicon-polymer-based hybrids: from biosensing to drug delivery.Nanomedicine (Lond). 2011 Dec;6(10):1755-70. doi: 10.2217/nnm.11.153. Nanomedicine (Lond). 2011. PMID: 22122584 Review.
Cited by
-
Rational Design of Photonic Dust from Nanoporous Anodic Alumina Films: A Versatile Photonic Nanotool for Visual Sensing.Sci Rep. 2015 Aug 6;5:12893. doi: 10.1038/srep12893. Sci Rep. 2015. PMID: 26245759 Free PMC article.
-
A sustained intravitreal drug delivery system with remote real time monitoring capability.Acta Biomater. 2015 Sep;24:309-21. doi: 10.1016/j.actbio.2015.06.012. Epub 2015 Jun 15. Acta Biomater. 2015. PMID: 26087110 Free PMC article.
-
Electrochemical Engineering of Nanoporous Materials.Nanomaterials (Basel). 2018 Sep 6;8(9):691. doi: 10.3390/nano8090691. Nanomaterials (Basel). 2018. PMID: 30200552 Free PMC article. No abstract available.
-
Sustained delivery of a HIF-1 antagonist for ocular neovascularization.J Control Release. 2013 Dec 28;172(3):625-33. doi: 10.1016/j.jconrel.2013.10.008. Epub 2013 Oct 12. J Control Release. 2013. PMID: 24126220 Free PMC article.
-
Amine-modified hyaluronic acid-functionalized porous silicon nanoparticles for targeting breast cancer tumors.Nanoscale. 2014 Sep 7;6(17):10377-87. doi: 10.1039/c4nr02187h. Nanoscale. 2014. PMID: 25074521 Free PMC article.
References
-
- Levy L, Sahoo Y, Kim K-S, Bergey EJ, Prasad NP. Nanochemistry: synthesis and characterization of multi-functional nanoclinics for biological applications. Chem Mater. 2002;14:3715–3721.
-
- Barar J, Javadzadeh AR, Omidi Y. Ocular novel drug delivery: impacts of membranes and barriers. Expert Opin Drug Deliv. 2008;5:567–581. - PubMed
-
- Guidetti B, Azema J, Malet-Martino M, Martino R. Delivery systems for the treatment of proliferative vitreoretinopathy: materials, devices and colloidal carriers. Curr Drug Delivery. 2008;5:7–19. - PubMed
-
- Nagarwal RC, Kant S, Singh PN, Maiti P, Pandit JK. Polymeric nanoparticulate system: a potential approach for ocular drug delivery. J Controlled Release. 2009;136:2–13. - PubMed
Publication types
MeSH terms
Substances
Grants and funding
LinkOut - more resources
Full Text Sources
