. 2011 Feb 4;286(5):4003-10.
doi: 10.1074/jbc.M110.168435. Epub 2010 Dec 1.

Deactivation of STAT6 through serine 707 phosphorylation by JNK

Affiliations

Deactivation of STAT6 through serine 707 phosphorylation by JNK

Takashi Shirakawa et al. J Biol Chem. .

Abstract

Signal transducer and activator of transcription 6 (STAT6), which plays a critical role in immune responses, is activated by interleukin-4 (IL-4). Activity of STAT family members is regulated primarily by tyrosine phosphorylations and possibly also by serine phosphorylations. Here, we report a previously undescribed serine phosphorylation of STAT6, which is activated by cell stress or by the pro-inflammatory cytokine, interleukin-1β (IL-1β). Our analyses suggest that Ser-707 is phosphorylated by c-Jun N-terminal kinase (JNK). Phosphorylation decreases the DNA binding ability of IL-4-stimulated STAT6, thereby inhibiting the transcription of STAT6-responsive genes. Inactivation of STAT6 by JNK-dependent Ser-707 phosphorylation may be one mechanism of controlling the balance between IL-1β and IL-4 signals.


Figures

FIGURE 1.
FIGURE 1.
Bioactive small molecules induce phosphorylation of STAT6. A, treatment with several bioactive compounds induced a STAT6 mobility shift. HeLa cells were incubated with DMSO, anisomycin (Aniso; 500 ng/ml, 1 h), nocodazole (Noco; 80 ng/ml, 16 h), taxol (500 nm, 16 h), colchicine (Colch; 200 nm, 16 h), MG-132 (10 μm, 16 h), or NaCl (0.2 m, 1 h). Whole cell lysates were separated by 5% SDS- polyacrylamide gels and analyzed by Western blotting using anti-STAT6 antibody. Arrow shows a mobility shift band. B, effects of CIAP treatment on a STAT6 mobility shift. Whole cell lysates from anisomycin-treated HeLa cells were reacted with CIAP or co-reacted with CIAP and phosphatase inhibitor, NaH2PO4 or Na3VO4. The reaction mix was separated by 5% SDS-polyacrylamide gels and analyzed by Western blotting, using anti-STAT6 antibody (upper panel) or anti-β-actin (lower panel). β-Actin served as a loading control. The arrow shows a mobility shift band.
FIGURE 2.
FIGURE 2.
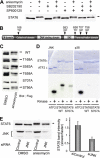
STAT6 Ser-707 is directly phosphorylated by JNK. A, effects of kinase inhibitor, SB202190 for p38 and SP600125 for JNK, on phosphorylation of STAT6. The levels of phosphorylation of STAT6 were observed as a mobility shift. HeLa cells were co-treated for 1 h with anisomycin (500 ng/ml) and SB202190 (10 μm), SP600125 (20 μm), or both inhibitors. The whole cell lysates were separated by 5% SDS-polyacrylamide gels and analyzed by Western blotting, using anti-STAT6 antibody. The arrow shows a mobility shift band. B, schematic representation of STAT6 and potential sites of phosphorylation by MAPK. C, effects of anisomycin treatment on the phosphorylation of Flag-STAT6WT (wild-type) and five Flag-STAT6 mutants, T168A, S583A, T658A, S707A, and S756A, transiently expressed in HeLa cells. The HeLa cells were incubated with DMSO or anisomycin (500 ng/ml) for 1 h. The levels of phosphorylation of STAT6 and its mutants were observed as a mobility shift. STAT6 and its mutants were detected by using anti-Flag antibody. The upper arrow shows GST-STAT6 and lower arrow shows GST-ATF2. D, in vitro kinase assay of recombinant GST-STAT6 protein by purified active JNK and p38. Purified GST-ATF2 (lanes 1 and 2), GST-STAT6WT (lanes 3 and 4) and GST-STAT6S707A (lanes 5 and 6) were incubated in the presence or absence of purified active JNK (left panel) or p38 (right panel), separated by 10% SDS-polyacrylamide gels, and analyzed by Coomassie staining (upper panel) and autoradiogram (lower panel). E, effects of JNK knockdown on Ser-707 phosphorylation of STAT6. JNK siRNA or control siRNA were transfected in HeLa cells, which were incubated with DMSO or anisomycin (500 ng/ml) for 1 h. The levels of phosphorylation of STAT6 were observed as a mobility shift. The expression levels of endogenous JNK were analyzed by Western blotting, using anti-JNK antibody. STAT6 (left upper panel) and JNK (left lower panel) are shown. Quantification of slower-migrating bands in anisomycin-treated cells (right panel). Values are means ± S.D. of three independent experiments. The arrow shows a mobility shift band.
FIGURE 3.
FIGURE 3.
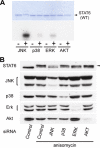
Specificity of kinases for Ser-707 phosphorylation of STAT6. A, purified GST-STAT6WT was incubated in the presence or absence of purified active JNK (lanes 1 and 2), p38 (lanes 3 and 4), ERK (lanes 5 and 6), or AKT (lanes 7 and 8). Products were separated on a 10% SDS-polyacrylamide gel, and analyzed by Coomassie staining (upper panel) or autoradiogram (lower panel). B, effects of JNK, p38, ERK, or AKT knockdown on Ser-707 phosphorylation of STAT6. siRNAs were transfected into HeLa cells, which were incubated with DMSO (control) or anisomycin (500 ng/ml) for 45 min. The levels of Ser-707 phosphorylation of STAT6 were observed as a mobility shift in Western blots. The arrow indicates a shifted band.
FIGURE 4.
FIGURE 4.
Repression of IL-4-induced transcriptional activity of STAT6 by Ser-707 phosphorylation. A, effects of anisomycin treatment on IL-4-indcued transcriptional activity of STAT6. HeLa cells were incubated with DMSO or anisomycin (Aniso; 500 ng/ml) for 1 h, and stimulated by IL-4 (10 ng/ml) for 0–8 h. The mRNA levels of CCL26 (upper panel) and GAPDH (lower panel) were quantified by RT-PCR. GAPDH served as a loading control. B, effects of JNK inhibitor on IL-4-indcued transcriptional activity of STAT6 in anisomycin-treated cells. HeLa cells were co-incubated with anisomycin (Aniso; 500 ng/ml) and JNK inhibitor, SP600125 (20 μm), for 1 h, then stimulated by IL-4 (10 ng/ml) for 6 h. The CCL26 levels were quantified by RT-PCR. C, IL-4-induced transcriptional activity of STAT6 in anisomycin-treated cells with WT and S707A mutant STAT6. WT or S707A mutant-expressed HEK293 cells were incubated with anisomycin for 1 h, then stimulated by IL-4 (10 ng/ml) for 6 h. The CCL26 levels were quantified by RT-PCR.
FIGURE 5.
FIGURE 5.
Analysis of repression mechanism for transcriptional activity of Ser-707-phosphorylated STAT6. A, effects of anisomycin treatment on tyrosine phosphorylation levels of STAT6. HeLa cells were incubated with anisomycin (Aniso; 500 ng/ml) for 1 h, then stimulated by IL-4 (10 ng/ml) for 30 min. The whole cell lysates were separated by 5% SDS-polyacrylamide gels and analyzed by Western blotting, using anti-pY STAT6 (upper panel), anti-STAT6 (middle panel), or anti-β-actin antibodies (lower panel). β-Actin served as a loading control. B, effects of anisomycin treatment on dimerization levels of STAT6. Whole cell lysates prepared as described for A were reacted by cross-linking reagent (DSS, 0.5 mm) for 30 min, then the reaction mixtures were analyzed as described for A using anti-pY STAT6 antibody. The arrow shows a band of STAT6 dimer. C, effects of anisomycin treatment on dimerization levels of STAT6. HEK293 cells were transiently co-transfected with expression vectors of Myc-tagged and Flag-tagged STAT6. After 24 h, the cells were incubated with anisomycin (Aniso; 500 ng/ml) for 1 h, and then stimulated by 10 ng/ml IL-4 for 30 min. The cell extracts were immunoprecipitated with anti-Myc-agarose beads. The immunoprecipitated samples and the input sample (1%) were resolved by 5% SDS-PAGE and analyzed by Western blotting with anti-Flag (upper panel) and anti-Myc (lower panel) antibodies. D, effects of anisomycin treatment on nuclear translocation of STAT6. HeLa cells were incubated with anisomycin (Aniso; 500 ng/ml) for 1 h, then stimulated by 10 ng/ml IL-4 for 30 min. The cell lysates were fractionated into nuclear and cytoplasmic compartments. Each compartment was subsequently analyzed by Western blotting, using anti-pY STAT6 (upper panel), anti-STAT6 (upper middle panel), anti-PARP (lower middle panel), or anti-α-tubulin (lower panel) antibodies. PARP and α-tubulin served as nuclear and cytoplasmic controls, respectively. E, effects of anisomycin treatment on DNA binding affinity of endogenous STAT6. HeLa cells were incubated with anisomycin (Aniso; 500 ng/ml) for 1 h, then stimulated by 10 ng/ml IL-4 for 30 min. Twenty micrograms of whole cell lysates, prepared using buffer C, were used for EMAS, with N6-GAS as a probe. F, DAN binding activities of STAT6WT and S707A mutant in the presence of anisomycin. HEK293 cells expressing WT or S707A mutant of STAT6 were incubated with anisomycin (Aniso; 500 ng/ml) for 1 h, and then stimulated by 10 ng/ml IL-4 for 30 min. DNA binding activities were analyzed by EMSA as described in E.
FIGURE 6.
FIGURE 6.
Ser-707 phosphorylation and down-regulation of STAT6 by IL-1β. A, induction of the STAT6 mobility shift by IL-1β treatment. HeLa cells were stimulated by 10 ng/ml IL-1β for 1 h, then the whole cell lysates were separated by 5% SDS-polyacrylamide gels and analyzed by Western blotting using anti-STAT6 antibody. B, induction of STAT6 Ser-707 phosphorylation by IL-1β stimulation. S707A mutant was transiently overexpressed in HeLa cells, which were stimulated by 10 ng/ml IL-1β for 1 h. The whole cell lysates were separated by 5% SDS-polyacrylamide gels and analyzed by Western blotting using anti-Flag antibody. C, effects of IL-1β stimulation on DNA binding affinity of STAT6. HeLa cells were stimulated by 10 ng/ml IL-1β for 1 h, then stimulated by 10 ng/ml IL-4 for 30 min. Twenty micrograms of whole cell lysates, prepared using buffer C, were used for EMSA, with N6-GAS as a probe.
FIGURE 7.
FIGURE 7.
Ser-707 phosphorylation of STAT6 inhibits overlap between IL-1β and IL-4 signals. A, effects of IL-1β and IFN-γ signals on IL-4-induced transcriptional activity of STAT6. HeLa cells were stimulated with 10 ng/ml IL-1β or IFN-γ for 1 h, then stimulated by 10 ng/ml IL-4 for 6 h. The mRNA levels of CCL26 (upper panel) and GAPDH (lower panel) were quantified by RT-PCR. B, induction of SOCS-1 and -3 gene expression by stimulation with IL-1β or IFN-γ. HeLa cells were stimulated with 10 ng/ml IL-1β or IFN-γ for 6 h, then the mRNA levels of SOCS-1 (upper panel), SOCS-3 (middle panel), and GAPDH (lower panel) were quantified by RT-PCR. GAPDH served as a loading control. C, comparison of Ser-707 phosphorylation levels with IL-1β and IFN-γ stimulation. Whole cell lysates were separated by 5% SDS-polyacrylamide gels and analyzed by Western blotting, using anti-STAT6 antibody.

Similar articles

Cited by

References

    1. Darnell J. E., Jr., Kerr I. M., Stark G. R. (1994) Science 264, 1415–1421 - PubMed
    1. Darnell J. E., Jr. (1997) Science 277, 1630–1635 - PubMed
    1. Ivashkiv L. B., Hu X. (2004) Arthritis Res. Ther. 6, 159–168 - PMC - PubMed
    1. Ihle J. N. (1996) Cell 84, 331–334 - PubMed
    1. Hou J., Schindler U., Henzel W. J., Ho T. C., Brasseur M., McKnight S. L. (1994) Science 265, 1701–1706 - PubMed

Publication types