A probabilistic approach to identify putative drug targets in biochemical networks
- PMID: 21123256
- PMCID: PMC3104352
- DOI: 10.1098/rsif.2010.0540
A probabilistic approach to identify putative drug targets in biochemical networks
Abstract
Network-based drug design holds great promise in clinical research as a way to overcome the limitations of traditional approaches in the development of drugs with high efficacy and low toxicity. This novel strategy aims to study how a biochemical network as a whole, rather than its individual components, responds to specific perturbations in different physiological conditions. Proteins exerting little control over normal cells and larger control over altered cells may be considered as good candidates for drug targets. The application of network-based drug design would greatly benefit from using an explicit computational model describing the dynamics of the system under investigation. However, creating a fully characterized kinetic model is not an easy task, even for relatively small networks, as it is still significantly hampered by the lack of data about kinetic mechanisms and parameters values. Here, we propose a Monte Carlo approach to identify the differences between flux control profiles of a metabolic network in different physiological states, when information about the kinetics of the system is partially or totally missing. Based on experimentally accessible information on metabolic phenotypes, we develop a novel method to determine probabilistic differences in the flux control coefficients between the two observable phenotypes. Knowledge of how differences in flux control are distributed among the different enzymatic steps is exploited to identify points of fragility in one of the phenotypes. Using a prototypical cancerous phenotype as an example, we demonstrate how our approach can assist researchers in developing compounds with high efficacy and low toxicity.
© 2010 The Royal Society
Figures

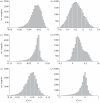

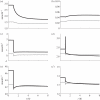
 (see text) are not represented in the graph. The grey plane in (a) represents the set of points in the three-dimensional space sharing the same score, as defined by equation (3.4). Different scores are represented by different planes, parallel to each other. (b–d) show the orthogonal projections of the three-dimensional scatter-plot shown in (a).
Similar articles
-
Monte-Carlo modeling of the central carbon metabolism of Lactococcus lactis: insights into metabolic regulation.PLoS One. 2014 Sep 30;9(9):e106453. doi: 10.1371/journal.pone.0106453. eCollection 2014. PLoS One. 2014. PMID: 25268481 Free PMC article.
-
[Development of antituberculous drugs: current status and future prospects].Kekkaku. 2006 Dec;81(12):753-74. Kekkaku. 2006. PMID: 17240921 Review. Japanese.
-
Integration of probabilistic regulatory networks into constraint-based models of metabolism with applications to Alzheimer's disease.BMC Bioinformatics. 2019 Jul 10;20(1):386. doi: 10.1186/s12859-019-2872-8. BMC Bioinformatics. 2019. PMID: 31291905 Free PMC article.
-
Estimating the size of the solution space of metabolic networks.BMC Bioinformatics. 2008 May 19;9:240. doi: 10.1186/1471-2105-9-240. BMC Bioinformatics. 2008. PMID: 18489757 Free PMC article.
-
Metabolic Network Reconstructions to Predict Drug Targets and Off-Target Effects.Methods Mol Biol. 2020;2088:315-330. doi: 10.1007/978-1-0716-0159-4_14. Methods Mol Biol. 2020. PMID: 31893380 Review.
Cited by
-
What can we learn from global sensitivity analysis of biochemical systems?PLoS One. 2013 Nov 14;8(11):e79244. doi: 10.1371/journal.pone.0079244. eCollection 2013. PLoS One. 2013. PMID: 24244458 Free PMC article.
-
Explicit consideration of topological and parameter uncertainty gives new insights into a well-established model of glycolysis.FEBS J. 2013 Sep;280(18):4640-51. doi: 10.1111/febs.12436. Epub 2013 Aug 19. FEBS J. 2013. PMID: 23865459 Free PMC article.
-
Monte-Carlo modeling of the central carbon metabolism of Lactococcus lactis: insights into metabolic regulation.PLoS One. 2014 Sep 30;9(9):e106453. doi: 10.1371/journal.pone.0106453. eCollection 2014. PLoS One. 2014. PMID: 25268481 Free PMC article.
-
Synthetic biology and regulatory networks: where metabolic systems biology meets control engineering.J R Soc Interface. 2016 Apr;13(117):20151046. doi: 10.1098/rsif.2015.1046. Epub 2016 Apr 13. J R Soc Interface. 2016. PMID: 27075000 Free PMC article. Review.
-
Dynamic modelling under uncertainty: the case of Trypanosoma brucei energy metabolism.PLoS Comput Biol. 2012 Jan;8(1):e1002352. doi: 10.1371/journal.pcbi.1002352. Epub 2012 Jan 19. PLoS Comput Biol. 2012. PMID: 22379410 Free PMC article.
References
-
- Majumder H. K. 2008. Drug targets in kinetoplastid parasites. Advances in experimental medicine and biology, vol. 625 Berlin, Germany: Springer - PubMed
-
- Groen A. K., Wanders R. J., Westerhoff H. V., van der Meer R., Tager J. M. 1982. Quantification of the contribution of various steps to the control of mitochondrial respiration. J. Biol. Chem. 257, 2754–2757 - PubMed
-
- Bakker B. M., Assmus H. E., Bruggeman F., Haanstra J. R., Klipp E., Westerhoff H. 2002. Network-based selectivity of antiparasitic inhibitors. Mol. Biol. Rep. 29, 1–510.1023/A:1020397513646 (doi:10.1023/A:1020397513646) - DOI - DOI - PubMed
-
- Gerber S., Assmus H., Bakker B., Klipp E. 2008. Drug-efficacy depends on the inhibitor type and the target position in a metabolic network—a systematic study. J. Theoret. Biol. 252, 442–45510.1016/j.jtbi.2007.09.027 (doi:10.1016/j.jtbi.2007.09.027) - DOI - DOI - PubMed
-
- Westerhoff H. V. 2007. Systems biology: new paradigms for cell biology and drug design, systems biology, pp. 45–67 Berlin, Germany: Springer - PubMed
Publication types
MeSH terms
Substances
Grants and funding
- BB/C0082191/BB_/Biotechnology and Biological Sciences Research Council/United Kingdom
- BB/I004696/1/BB_/Biotechnology and Biological Sciences Research Council/United Kingdom
- BBD0190791/BB_/Biotechnology and Biological Sciences Research Council/United Kingdom
- BBF003535521/BB_/Biotechnology and Biological Sciences Research Council/United Kingdom
- EP/F500 009/1/BB_/Biotechnology and Biological Sciences Research Council/United Kingdom
- BB/C008219/1/BB_/Biotechnology and Biological Sciences Research Council/United Kingdom
- BBF003535361/BB_/Biotechnology and Biological Sciences Research Council/United Kingdom
- BBF003535281/BB_/Biotechnology and Biological Sciences Research Council/United Kingdom
- BB/I00470X/1/BB_/Biotechnology and Biological Sciences Research Council/United Kingdom
LinkOut - more resources
Full Text Sources

