Comparative Study
. 2010 Dec 1;30(48):16180-7.
doi: 10.1523/JNEUROSCI.3202-10.2010.

Leptin rapidly improves glucose homeostasis in obese mice by increasing hypothalamic insulin sensitivity

Affiliations
Comparative Study

Leptin rapidly improves glucose homeostasis in obese mice by increasing hypothalamic insulin sensitivity

Christiane Koch et al. J Neurosci. .

Abstract

Obesity is associated with resistance to the actions of both leptin and insulin via mechanisms that remain incompletely understood. To investigate whether leptin resistance per se contributes to insulin resistance and impaired glucose homeostasis, we investigated the effect of acute leptin administration on glucose homeostasis in normal as well as leptin- or leptin receptor-deficient mice. In hyperglycemic, leptin-deficient Lep(ob/ob) mice, leptin acutely and potently improved glucose metabolism, before any change of body fat mass, via a mechanism involving the p110α and β isoforms of phosphatidylinositol-3-kinase (PI3K). Unlike insulin, however, the anti-diabetic effect of leptin occurred independently of phospho-AKT, a major downstream target of PI3K, and instead involved enhanced sensitivity of the hypothalamus to insulin action upstream of PI3K, through modulation of IRS1 (insulin receptor substrate 1) phosphorylation. These data suggest that leptin resistance, as occurs in obesity, reduces the hypothalamic response to insulin and thereby impairs peripheral glucose homeostasis, contributing to the development of type 2 diabetes.


Figures

Figure 1.
Figure 1.
Body weight, glucose concentration, and associated AUC and body composition of Lepob/ob mice after food restriction. a, Body weight trajectory of Lepob/ob mice (black; n = 10) and control Lepob/+ mice (white; n = 10). Two subgroups of Lepob/ob mice (red and gray; n = 4–6 animals/group) were pair-fed during the first 8 d of the experiment followed by a further reduction of available food to 2–3 g/d to match the body weight of the controls. Data show means ± SEM. b, c, ipGTT (b) and integrated AUC (c) of food-restricted Lepob/ob mice pretreated with PBS or leptin (1.25 mg/kg) 15 min before glucose application (1 g/kg). White, Ad libitum-fed vehicle (PBS)-treated Lepob/+ mice; red, food-restricted leptin-treated Lepob/ob mice; gray, food-restricted vehicle (PBS)-treated Lepob/ob mice; black, ad libitum-fed vehicle (PBS)-treated Lepob/ob mice. Data show means ± SEM. *p < 0.05, **p < 0.01, ***p < 0.001. d, Representative DEXA-Scan images of one animal in each treatment group. The image was taken immediately after the ipGTT was performed. e, Correlation of AUC and body fat mass of ad libitum-fed Lepob/+ mice, ad libitum-fed Lepob/ob mice, and slim pair-fed/food-restricted Lepob/ob mice, which received a vehicle or leptin injection. Note the lack of correlation between fat content in GTT AUC in individual treatment groups.
Figure 2.
Figure 2.
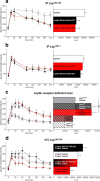
Glucose concentrations (left) and associated AUC (right) during ipGTT in a range of leptin- and leptin receptor-deficient mice. a, Leptin very acutely improves glucose tolerance in obese, ad libitum-fed Lepob/ob mice (1.25 mg/kg, i.p.). AUC was significantly decreased by leptin pretreatment compared with PBS-pretreated Lepob/ob mice, independent of the injection time. White, Vehicle (PBS); black: intraperitoneal leptin injection 90 min before glucose application; red, intraperitoneal leptin injection 15 min before glucose application. Vehicle, n = 4 animals; leptin, n = 5 animals/group; Data show means ± SEM. *p < 0.05. b, Heterozygous controls to experiment presented in a. Leptin had no effect on normal glucose tolerance in Lepob/+ mice. White, Vehicle (PBS); black, intraperitoneal leptin injection 90 min before glucose application; red, intraperitoneal leptin injection 15 min before glucose application. Vehicle, n = 6 animals; leptin, n = 5 animals/group; Data show means ± SEM. c, Leptin (1.25 mg/kg, i.p.) did not ameliorate the glucose tolerance and AUC of mice lacking leptin receptor in the forebrain. White, Leprfl/fl mice (lean, n = 6) received a vehicle (PBS) injection; brown, Leprfl/fl mice (n = 5) received a leptin injection; dark gray, Leprfl/fl × CaMKIIα-Cre mice (obese, n = 6) received a vehicle (PBS) injection; red, Leprfl/fl × CaMKIIα-Cre mice (n = 5) received a leptin injection; light gray, Leprdb/db mice (obese, n = 5) received a vehicle (PBS) injection. Since the GTT for the Leprdb/db mice was terminated after 90 min, two AUCs are presented. Shaded bars show the AUC of all treatment groups over 90 min, while plain bars show AUC of all treatment groups (except Leprdb/db mice) over 180 min. Data show means ± SEM. n.s., Nonsignificant. d, Central application of leptin 60 min before ipGTT (1 g/kg) ameliorated the glucose tolerance similar to intraperitoneal injection of the hormone. The effect was completely blocked by intracerebroventricular pretreatment with isoform selective PI3K inhibitors PIK-75 (specific for p110α) and TGX-221 specific for (p110β). Inhibitors (0.1 nm each) were given 45 min before intracerebroventricular leptin injection (4 μg). White, Vehicle (aCSF/5% DMSO)/vehicle (aCSF), n = 5 animals; red, vehicle (aCSF/5% DMSO)/leptin, n = 5 animals; black, PIK-75+TGX 221/aCSF, n = 6 animals; black/red, PIK-75 +TGX 221/leptin, n = 6 animals. Data show means ± SEM. *p < 0.05.
Figure 3.
Figure 3.
Crosstalk of insulin and leptin on phosphorylation of AKT(Ser 473) in the ARC. a, Representative images showing phospho-AKT(Ser473) immunoreactivity in the ARC of Lepob/+ mice. Mice received either two vehicle (PBS) injections (top), or a vehicle followed by an insulin injection (1 mg/kg, bottom). Scale bar, 30 μm. b, Insulin signaling is impaired in the ARC of Lepob/ob mice and can be restored by leptin replacement. Lepob/ob and Lepob/+ mice received two intraperitoneal injections 15 min apart with either vehicle/vehicle, vehicle/insulin, leptin/vehicle, or leptin/insulin. In Lepob/+ mice, insulin (1 mg/kg) markedly increased the number of phospho-AKT (Ser 473)-immunoreactive cells in the ARC, whereas leptin (2 mg/kg) had only a minor effect. Leptin did not further enhance the action of insulin. In Lepob/ob mice, insulin signaling was impaired as reflected in a decrease in insulin-induced phospho-AKT expression. Leptin pretreatment, however, could partially restore insulin signaling in the leptin/insulin group. Vehicle, n = 2 animals/group; insulin, leptin, and leptin/insulin, n = 4 animals/group. Data show means ± SEM. *p < 0.05, **p < 0.01, ***p < 0.001. c, Leptin receptor-deficient mice exhibit impaired insulin signaling in the ARC. Leprdb/db mice and their controls (Leprdb/+) received an intraperitoneal insulin injection (1 mg/kg) 15 min before transcardial perfusion. phospho-AKT(Ser473)-immunoreactive cells were counted in the ARC. Gray bars depict the vehicle (PBS)-treated whereas the black bars depict the insulin (1 mg/kg)-treated groups of the respective genotype (n = 3–6). Data show means ± SEM. d, Mice with a neuron-specific deletion of the leptin receptor (Leprfl/fl × CaMKIIα-Cre) also exhibit impaired insulin signaling in the hypothalamus. The experimental paradigm was identical to Figure 3c, and the respective controls were Leprfl/fl mice. Vehicle n = 3 animals/group; insulin n = 5 animals/group. Data show means ± SEM. *p < 0.05, **p < 0.01. e, A leptin receptor antagonist blocks insulin-induced pAKT in healthy, nondiabetic Sprague Dawley rats. The leptin antagonist was injected (200 μg) immediately before insulin (10 mU) was injected. One group received a vehicle injection (aCSF) followed by leptin (4 μg), one the antagonist, followed by leptin (4 μg), and one vehicle (aCSF) followed by insulin (10 mU). The insulin-induced phosphorylation of AKT (Ser473) was blocked by an intracerebroventricular injection of the leptin antagonist (200 μg) directly before insulin injection. All injections were intracerebroventricular. Red, aCSF/leptin, n = 3 animals; red/white, leptin antagonist/leptin, n = 3 animals; black, aCSF/insulin, n = 4 animals; black/white, leptin antagonist/insulin, n = 4 animals. *p < 0.05.
Figure 4.
Figure 4.
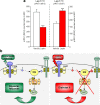
IRS phosphorylation in the hypothalamus: a potential mechanism for leptin's action on glycemia? a, Analysis of phospho-IRS1(Ser612) (left) and for phospho-IRS1(Ser307) (right) by immunohistochemistry in the ARC of Lepob/ob mice (n = 5–6 animals/group). phospho-IRS1-immunoreactive cells within the medial part of the ARC were counted in four region-matched representative sections of each animal. Fifteen minutes after either vehicle (aCSF) or leptin (4 μg) intracerebroventricular injection, animals were transcardially perfused. Data show means ± SEM. ***p < 0.001. b, Model proposing the central mechanism of sensitization of insulin signaling by leptin. In nonobese, leptin-sensitive animals, leptin might activate IRS1 to promote insulin action through the IRS1-PI3K pathway to regulate glucose homeostasis (left). During obesity, with the onset of leptin resistance, leptin might lose its ability to activate IRS1, resulting in a modification of this molecule to a lower affinity to insulin signal transduction (right). This will result in chronically impaired insulin signaling and the development of type 2 diabetes. LepR, Leptin receptor; IR, insulin receptor; JAK, Janus kinase.

Similar articles

Cited by

References

    1. Brüning JC, Gautam D, Burks DJ, Gillette J, Schubert M, Orban PC, Klein R, Krone W, Müller-Wieland D, Kahn CR. Role of brain insulin receptor in control of body weight and reproduction. Science. 2000;289:2122–2125. - PubMed
    1. Choudhury AI, Heffron H, Smith MA, Al-Qassab H, Xu AW, Selman C, Simmgen M, Clements M, Claret M, Maccoll G, Bedford DC, Hisadome K, Diakonov I, Moosajee V, Bell JD, Speakman JR, Batterham RL, Barsh GS, Ashford ML, Withers DJ. The role of insulin receptor substrate 2 in hypothalamic and beta cell function. J Clin Invest. 2005;115:940–950. - PMC - PubMed
    1. Copps KD, Hancer NJ, Opare-Ado L, Qiu W, Walsh C, White MF. Irs1 serine 307 promotes insulin sensitivity in mice. Cell Metab. 2010;11:84–92. - PMC - PubMed
    1. Farooqi IS, Jebb SA, Langmack G, Lawrence E, Cheetham CH, Prentice AM, Hughes IA, McCamish MA, O'Rahilly S. Effects of recombinant leptin therapy in a child with congenital leptin deficiency. N Engl J Med. 1999;341:879–884. - PubMed
    1. Folli F, Bonfanti L, Renard E, Kahn CR, Merighi A. Insulin receptor substrate-1 (IRS-1) distribution in the rat central nervous system. J Neurosci. 1994;14:6412–6422. - PMC - PubMed

Publication types

MeSH terms